|
|
|
Copyright © 2003 by the author(s). Published here under license by The Resilience Alliance.
Go to the pdf version of this article.
The following is the established format for referencing this article:
Gowrie, M. N. 2003. Environmental vulnerability index for the island of Tobago, West Indies. Conservation Ecology 7(2): 11. [online] URL: http://www.consecol.org/vol7/iss2/art11/
A version of this article in which text, figures, tables, and appendices are separate files may be found by following this link.
Report Environmental Vulnerability Index for the Island of Tobago, West Indies Marissa N. Gowrie
University of the West Indies
- Abstract
- Introduction
- Literature Review
- Methods
- Results
- Discussion
- Responses to this Article
- Acknowledgments
- Literature Cited
This study investigated the environmental vulnerability index (EVI) for the island of Tobago. Based on the EVI study developed by the South Pacific Applied Geosciences Commission (SOPAC), the vulnerability index was determined for anthropogenic, meteorological, biological, and geological events and for general country characteristics. Written requests for information were made through appropriate government ministries, state agencies, private companies, and other environmental organizations, and the relevant data were obtained from available documents or interviews with appropriate professionals. These data were then used to calculate the values of the environmental indicators as directed by SOPAC, and the overall EVI for Tobago was determined by the average score of all these indicators. The results of the research revealed that, on a holistic level, the island of Tobago scored relatively low on the EVI scale. Although most indicators received a score of 4 or less, selected indicators received scores of 6 and 7, which indicated a high vulnerability for these indicators. It was found that the indicators with the highest scores were mostly anthropogenic in origin or could be traced to some man-made influence. It was concluded that Tobago's vulnerability could to a large extent be controlled by vigilant management of the island's resources, coupled with information sharing between the agencies governing these resources.
KEY WORDS: environmental vulnerability index, South Pacific Applied Geosciences Commission, Tobago, anthropogenic hazards, calculation method.
Published: November 21, 2003
The state of Trinidad and Tobago comprises the two southernmost islands of the West Indies, which are situated on the continental shelf of South America just off the coast of Venezuela. Trinidad, the larger island, measures roughly 100 km from north to south and 65 km from east to west, with prominent peninsulas at the northwest and southwest corners. Tobago is roughly 33 km long and 7 km wide. The total area of both islands is 5125 km2, with 4825 km2 in Trinidad and 300.8 km2 in Tobago.
Because of its small size, Tobago has many of the problems common to small island developing states (SIDS), among them vulnerability because of remoteness, geographical dispersion, natural hazards, and small internal markets.
The topography of Tobago is dominated by the Main Ridge mountain, which occupies the center of the island. These northeast hills of volcanic origin are forested and quite wild. The southwest of the island is flat or undulating and coralline. The largest rivers on the island are the Courland, the Richmond, and the Goldsborough. There are swamps and sea grass beds on the island in addition to a major ecosystem, which is also a tourist attraction, called the Buccoo Reef. This reef is located around the southwest tip of the island (Ecoengineering Consultants 1998).
As a result of its tiny land mass, the island has obvious limitations in terms of the carrying capacity of its environment. As the population increases through both natural means and tourism, more pressure is being placed on the environment, which can be detrimental if coupled with poor environmental management (Howorth 1999).
It is in this context that the environmental vulnerability index (EVI) for the island of Tobago was calculated. EVI values are calculated for the different islands in an effort to lessen natural and anthropogenic hazards on small islands. The South Pacific Applied Geosciences Commission (SOPAC), which is calculating EVIs for the islands of the South Pacific, defines "vulnerability" as the potential for the attributes of a system to respond adversely to the occurrence of hazardous events (Kaly et al. 1999).
This EVI study is being expanded to include the islands of the Caribbean region to give researchers a true appreciation of the issues that affect SIDS. To this end, the method of calculation and the units of measurements used by SOPAC were also used for this study of Tobago to ensure consistency with previous EVI studies and to allow easy comparison with islands in the South Pacific.
The calculation of the EVI is based on 47 indicators of environmental vulnerability, which have been selected by global scientific and expert review. This list includes 27 indicators of risk (REI), seven indicators of intrinsic resilience (IRI), and 13 indicators of environmental integrity or degradation (EDI). The indicators are also divided into five subcategories: six categories for meteorological events; three indicators for geological events; seven indicators for country characteristics, which are identical to the IRI; eight indicators for biological factors; and 23 indicators for anthropogenic factors. The indices are rated on a scale of 1–7, with 7 being the most vulnerable and 1 being the least. This study focused on the 80% of the 47 indicators for which there were adequate data, because they could be used to calculate a relatively accurate EVI.
According to the United Nations Environment Programme (2001), in recent years there have been some attempts to develop integrated indices related to various aspects of the environment within the framework of sustainable development. These attempts have been made by such organizations as the United Nations Commission on Sustainable Development, the World Economic Forum, the Advisory Board on Indicators of Sustainable Development of the International Institute for Sustainable Development, and the Living Planet Index established by the World Wide Fund for Nature (WWF).
Since 1995, the United Nations Commission on Sustainable Development has been conducting a work program on indicators for sustainable development. In this framework, the driving forces represent human activities, processes, and patterns that affect sustainable development. These indicators were developed for use in the decision-making process at the country level. At present, the Commission carries out this program through the contributions of numerous organizations and institutions worldwide that are devoted to the study and development of environmental and sustainability indicators (United Nations Environment Programme 2001).
In addition, the World Economic Forum, in conjunction with the Center for Environmental Policy and Law of Yale University and the Center for International Earth Science Information Network, recently developed the Pilot Index of Environmental Sustainability. This index was created as one element of a classification project and is based on five components: pollution, human vulnerability, the state of environment systems, social and institutional capacity to face environmental challenges, and global management.
In 1996, the Advisory Board on Indicators of Sustainable Development of the International Institute for Sustainable Development developed the Environmental Quality Index (EQI) as part of an index on global sustainability, complemented with information on economic yield and social health. The EQI comprises four components: an environmental pressure index, ecological footprints per capita, ecosystem risk, and the use of soil (United Nations Environment Programme 2001).
Another initiative to develop an environmental index was the Living Planet Index established by the WWF. This index measures the health of global ecosystems and biodiversity based on data that show the average change over time of forests, fresh water, and marine ecosystems in an effort to monitor the loss of biodiversity.
The environmental vulnerability index (EVI) of the South Pacific Commission for Applied Sciences (SOPAC), Fiji, focuses on the vulnerability of the environment to natural risks and to humans. Included are effects on the physical and biological aspects of the ecosystems, diversity, populations and organisms, communities, and species (United Nations Environment Programme 2001).
History of the environmental vulnerability index used by SOPACEnvironmental vulnerability indices are important tools for researchers, ecologists, environmental bodies, and government officials who are trying to measure the state of the environment against a predetermined benchmark. They also help highlight areas of concern within the environment, which leads to more efficient management of resources and protection of the integrity of the environment as a whole, thereby reducing vulnerability. The obvious limitation is that the environment is dynamic in nature, with the result that indices reflect only the current state of the environment and must be constantly reviewed to ensure accuracy. In addition, the reliability of the data can also influence the accuracy of the EVI. The need for an EVI for small island developing states (SIDS) was recognized by the Alliance of Small Island Developing States (1994:paragraphs 113–114).
Efforts have been made to determine EVIs in the past. However, there was never a clear understanding of what these indices represent, as seen in the emphasis placed on the vulnerability of human systems to risk and the lack of research into the vulnerability of the environment (Kaly and Pratt 2000). In an attempt to fill this void in environmental vulnerability research, the EVI was developed based on a wide cross section of indicators that include both anthropogenic and natural risks.
In 1996, initial studies were undertaken to provide a conceptual framework for the development of a vulnerability index. Further efforts were made to develop an economic vulnerability index and an ecological vulnerability index. These indices were reviewed by experts whose main task was to make a professional assessment of vulnerability and, based on their deliberations, identify the quantitative parameters that determine the relative vulnerability of countries. It was agreed that vulnerability indices should reflect relative economic and ecological susceptibility to exogenous shocks, i.e., the risk of a country being affected by such shocks. It was also decided that vulnerability indices should be simple to build and based on indicators that are easy to comprehend, intuitively meaningful, and suitable for intercountry comparisons that reflect the relative vulnerability of countries, both SIDS and non-SIDS (Kaly and Pratt 2000).
In 1998, the Commission for Sustainable Development indicated its support for the efforts of Pacific SIDS to develop an EVI by means of a SOPAC project. The EVI is a dimensionless numerical indicator that reflects the status of a country's environmental vulnerability. This index can serve many purposes, e.g., to determine the state of a country's development and environment and obtain information that can be used for the social, economic, and environmental benefit of the country on which the EVI is based. It is important to note that, because the social, economic, and environmental sectors are all interlinked, reliable indices should take all these factors into consideration. SOPAC has developed a conceptual approach framework for a workable EVI that has been tested in Fiji, Vanuatu, and Samoa.
The environmental vulnerability index (EVI) was designed to summarize a wide range of environmental vulnerability information about an individual country, and this EVI assesses the environmental vulnerability of Tobago. Because the environment of Tobago has not been studied in depth, much of the required environmental data are at present either unavailable or in the process of being collected and compiled. For this reasons, it was necessary to collect data from a variety of sources, including documents, government ministries, state agencies, private companies, and other environmental organizations. Information was also gathered through interviews and written requests for data from various agencies and companies in Trinidad and Tobago. The data gathered pertained to the particular indicator to be calculated and represented the 5-yr period 1996–2000. For the calculation of the indices, the findings for the 5-yr period were averaged to avoid biases toward any particular year.
Data for the meteorological indices were obtained from the Meteorological Services Division; data for the geological indices came from the Seismic Research Unit of the University of the West Indies; and data for the biological, anthropogenic, and country characteristic indices were obtained primarily from the Central Statistical Office, Forestry and Wildlife Division, the Port Authority of Trinidad and Tobago, the Fisheries Division, the Tourism and Industrial Development Company, the National Housing Authority, the Ministry of Energy, the Licensing Office, the Pan American Health Organization, and the Water and Sewerage Authority.
To be consistent with the methods of the South Pacific Applied Geosciences Commision, the calculation of the indices was based on the units of measurement used in the individual indices (Table 1).
|
Table 1. Summary of environmental vulnerability indices (EVIs) for Tobago. The types of EVI indicators include indicators of environmental risk (ERI), intrinsic resilience (IRI), and environmental degradation (EDI). The indicator subcategories include meteorological events (Met), geological events (G), country characteristics (CC), biological factors (B), and anthropogenic factors (A). The range is the range of units for the score obtained, and the unit is the unit of measurement. VEI stands for "volcano explosivity index," and MHWS for "mean high water spring."
| |||||||||||||||||||||||||||||||||||||||||||||||||||||||||||||||||||||||||||||||||||||||||||||||||||||||||||||||||||||||||||||||||||||||||||||||||||||||||||||||||||||||||||||||||||||||||||||||||||||||||||||||||||||||||||||||||||||||||||||||||||||||||||||||||||||||||||||||||||||||||||||||||||||||||||||||||||||||||||||||||||||||||||||||||||||||||||||||||||||||||||||||||||||||||||||||||||||||||||||||||||||||||||||||||||||||||||||||||||||||||||||||||||||||||||||||||||||||||||||||||||||||||||||||||||||||||||||||||||||||||||||||||||||||||||||||||||||||||||||||||||||||||||||||||||||||||||||||||||||||||||||||||||||||||||||
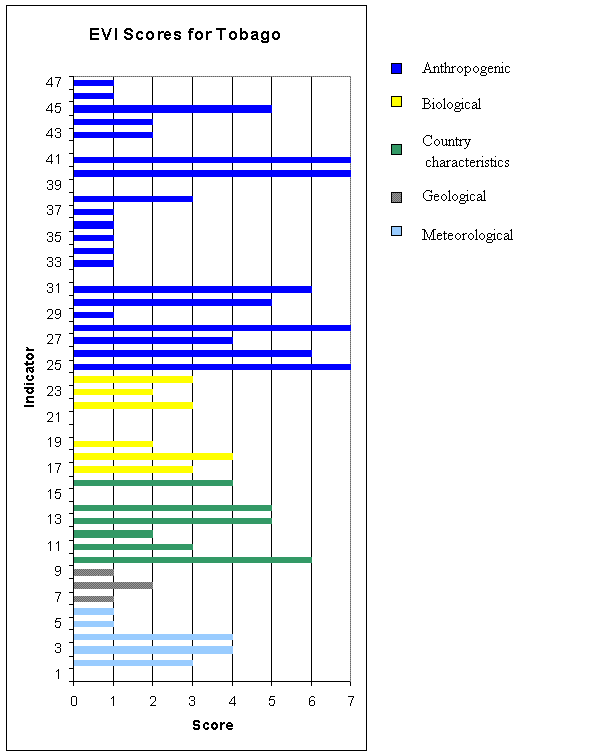
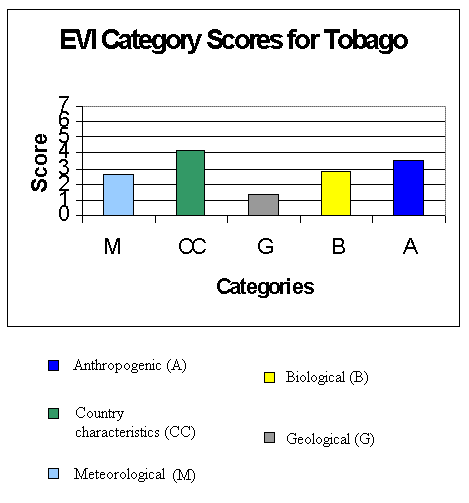
Based on the analysis of the data collected, the overall environmental vulnerability index (EVI) for the island of Tobago was determined to be 3.05. The intrinsic resilience index for Tobago was determined to be 4.2, the risk exposure index was 2.8, and the environmental degradation index was found to be 3.5. The meteorological index for Tobago was calculated to be 2.6, the biological index was 2.8, the geological index was measured at 1.3, and the anthropogenic index was found to be 3.5. Tobago scored a value of 4.2 for country characteristics. The individual scores for each of the indicators used to determine the overall index are illustrated in Table 1 and Figs. 1 and 2.
|
Fig. 1. Environmental vulnerability index (EVI) scores for Tobago.
|
|
Fig. 2. Environmental vulnerability index (EVI) category scores for Tobago.
|
It should be noted that the vulnerability indices calculated were subject to observation error, given that the data were not derived solely from field data but in many cases from previously documented data sources. Because of the dynamic nature of the environment, this EVI is not a fixed value, and it can change in the future to reflect changes in the environmental and man-made forces that influence it.
According to Kaly and Pratt (2000), the South Pacific islands of Fiji, Vanuatu, and Samoa are most vulnerable to issues involving land degradation, coastal settlements, water resources, land area, and population density. The overall vulnerability scores for these islands ranged from 3.1 to 3.4, which makes them moderately vulnerable to natural and man-made disasters.
The overall EVI score for the island of Tobago, 3.05, suggests that this island is, on a holistic level, slightly vulnerable to effects from meteorological, biological, anthropogenic, country-related, and geological sources. This score is very close to the range for the South Pacific islands of Fiji, Vanuatu, and Samoa, and implies that Tobago faces similar vulnerability issues.
Tobago's scores of 2.8 for the risk exposure index, 3.5 for the environmental degradation index, and 4.2 for the intrinsic resilience index are relatively low on the EVI scale and also support the finding that Tobago is slightly vulnerable to natural and man-made hazards. However, upon closer investigation of the individual indicators, it is evident that there are certain events that, when studied in isolation, have a profound effect on the environment and affect areas of high vulnerability for the island. The most important vulnerability issues for Tobago, i.e., those scoring a 7 on the EVI scale and identified using the EVI, relate to coastal settlements, land degradation, water resources, and the rate of loss of natural vegetation.
Tobago scored a 6 on the EVI scale in several other areas that represent the next most vulnerable aspects of the island. These included land area, particularly the island's small size; the density of the human population; and the production of municipal wastes. These vulnerability issues are consistent with those identified for the Small Island Developing States of the South Pacific, and it can be reasonably concluded that these issues seriously affect small island states and are areas of high to moderate vulnerability for Tobago. It should be noted that most of these issues are in some way related to anthropogenic or human activities.
These issues are particularly acute within the coastal settlement area and densely populated capital of the island, Scarborough. The island is at present highly vulnerable to incidental damage from human activities, pollution, eutrophication, and resource depletion as a result of the dense population on the island, which places considerable stress on natural ecosystems.
The increasing number of inhabitants as the population grows require more housing and infrastructure, which has led to considerable development of the island. In addition, because the tourism industry generates much of Tobago's revenue, many hotels, resorts, and guest houses have been constructed on the island. As a result, it is relatively vulnerable to the effects of the loss of vegetation caused by development. The processes within the natural ecosystem, including soil formation, carbon dioxide fixation, groundwater regeneration, and pollution attenuation, are therefore also at risk from ongoing land development on the island.
These anthropogenic activities create a particular hazard on such a small island. Problems related to land degradation, water resources, loss of natural vegetation, coastal settlements, and waste generation can be attributed to the high population density and unregulated and indiscriminate land development. In many cases, it is because of poor planning and management that the resources on the island have been depleted or threatened by some form of pollution.
With regard to the indicators that scored within the moderate range, i.e., 3–4, on the EVI scale, such as the use of pesticides, the growth rate of the human population, and fisheries, it can be concluded that the vulnerability of the island to problems in these areas would be greatly decreased with the careful management of natural resources and the monitoring of human activities. This study also revealed that, with respect to both terrestrial and aquatic biodiversity on the island, much research is still necessary, and in some cases baseline studies have yet to be undertaken. Such studies are critical for determining which species are present and accurately assessing their vulnerability. Other areas of concern highlighted by this study, including water usage and the rate of loss of natural vegetation on the island, can also be attributed to population pressures and increased development.
According to this study, the island of Tobago is at low risk for incidents such as oil spills, war, sulfur dioxide pollution, and pollution from toxic industries, vehicles, and fertilizers, all of which scored a value of 1, which is very low on the EVI scale. There is also relatively little vulnerability to surface mining and pollution from intensive farming, which scored a 2 on the EVI scale.
The areas of vulnerability discussed above for Tobago are consistent with the problems that were identified in previous EVI studies performed for the islands of Fiji, Samoa, and Vanuatu. Although these islands are situated in the Pacific Ocean in a geographically distinct region, they can be compared to Tobago because they all share characteristics that are typical of small island states. These characteristics are listed below:
- small size, which generally results in a limited natural resource base, high competition between different land uses, intensity of land use, and an immediate interdependence in human-environment systems;
- insularity and remoteness, which lead to high external transport costs, time delays and high costs in accessing external goods, and reduced quality in information flow;
- environmental factors such as small, exposed interiors and large coastal zones;
- reduced disaster mitigation capability because of limited forecasting abilities and complacency;
- demographic factors that include a limited human resource base and a small population concentrated in coastal zones, resulting in poor economies of scale and high per capita costs for infrastructure and services; and
- economic factors including small economies, dependence on external finance, a small internal market, and a dependence on natural resources.
These factors all make islands much more vulnerable than continents, which also possess more resilience to hazards because of their greater land mass, stronger economies, and more effective management and mitigation systems.
As Table 2 illustrates, the indicators that score high on the EVI scale for all four islands are land degradation, coastal settlements, waste management, water resources, land area, and population density. Because these are areas of moderate to high vulnerability, there is a need to strengthen the ability of these islands to resist or recover from damage in these sectors. Mismanagement in any of them can adversely affect the sustainable development strategies of these small island states, because it would result in a deterioration of the integrity of the environment.
|
Table 2. Comparison of environmental indices for Tobago, Fiji, Samoa, and Vanuatu. The types of EVI indicators include indicators of environmental risk (ERI), intrinsic resilience (IRI), and environmental degradation (EDI). The indicator subcategories include meteorological events (Met), geological events (G), country characteristics (CC), biological factors (B), and anthropogenic factors (A). VEI stands for "volcano explosivity index," and MHWS for "mean high water spring."
| |||||||||||||||||||||||||||||||||||||||||||||||||||||||||||||||||||||||||||||||||||||||||||||||||||||||||||||||||||||||||||||||||||||||||||||||||||||||||||||||||||||||||||||||||||||||||||||||||||||||||||||||||||||||||||||||||||||||||||||||||||||||||||||||||||||||||||||||||||||||||||||||||||||||||||||||||||||||||||||||||||||||||||||||||||||||||||||||||||||||||||||||||||||||||||||||||||||||||||||||||||||||||||||||||||||||||||||||||||||||||||||||||||||||||||||||||||||||||||||||||||||||||||||||||||||||||||||||||||||||||||||||||||||||||||||||||||||||||||||||||||||||||||||||||||||||||||||||||||||||||||||||||||||||||||||||||||||||||||||||||||||||||||||||||||||||||||||||||||||||||||||||||||||||||||||||||||||||||||||||||||||||||||||||||||||||||||||||||||||||||||||||||||||||||||||||||||||||||||||||||||||||||||||||||||
This study has shown that Tobago is most vulnerable to hazards from anthropogenic sources, moderately vulnerable to hazards from biological and meteorological sources, and least vulnerable to hazards from geological sources. In general, however, integrated and comprehensive management of the resources of the island of Tobago is necessary to sustainably use the available resources and to ensure that these resources are protected, in particular from uncontrolled anthropogenic events, which seem to have the most adverse affect on the natural ecosystems of this small island.
Management of these resources would be greatly aided by the enactment of suitable legislation in the areas of land use and pollution, in particular, effluent discharges and solid waste disposal. The establishment of a system of national parks would alleviate the problem of the loss of natural vegetation, as would more stringent development procedures. The implementation of a development plan and regulated land-use plans would reduce the problems associated with population density and unregulated development. Water resources management is critically important and requires a cooperative management approach that involves the regulatory agencies, hoteliers, and citizens. To this end, a well-functioning sewage system is vital for the proper management of the water resources.
Central to all these initiatives is the need for a comprehensive and consistent public education and awareness program aimed at sensitizing Tobago's citizens to the vulnerability of their environment and the ways in which they can help to make their island less vulnerable.
Responses to this article are invited. If accepted for publication, your response will be hyperlinked to the article. To submit a comment, follow this link. To read comments already accepted, follow this link.
I wish to thank all those who assisted in this research. Sincere thanks to my parents, brother, the governmental and nongovernmental agencies contacted during the course of this research, and my supervisors Dr. John Agard and the late Professor Peter Bacon of the University of the West Indies. The cost of publishing this article was paid for by the Resilience Alliance.
Alliance of Small Island States. 1994. Program of Action for the Sustainable Development of Small Island Developing States. United Nations, New York, New York, USA.
Ecoengineering Consultants. 1998. Environmental Management Authority and United Nations Development Programme pollutant inventory study of Trinidad and Tobago. Ecoengineering Consultants, St. Augustine, Trinidad and Tobago.
Howorth, R. Measuring how vulnerable islands are. Available online at: http://cobalt.sopac.org.fj/Projects/Evi/.
Kaly, U., L. Briguglio, H. Mc Leod, S. Schmall, C. Pratt, and R. Pal. 1999. Environmental vulnerability index (EVI) to summarise national environmental vulnerability profiles. SOPAC Technical Report, Number 275. South Pacific Applied Geosciences Commission, Fiji.
Kaly, U. L., and C. Pratt. 2000. Environmental vulnerability index: development and provisional indices for Fiji, Samoa, Tuvalu and Vanuatu. SOPAC Technical Report, Number 306. South Pacific Applied Geosciences Commission, Fiji.
United Nations Environmental Programme. 2001. Report on Environmental and Sustainability Indicators for Latin America and the Caribbean. Sixth Meeting of the Inter-Sessional Committee—Forum of Ministers of the Environment of Latin America and the Caribbean. UNEP/LACIG.XIII/Inf.4. UNEP, Nairobi, Kenya.
Address of Correspondent:
Marissa N. Gowrie
5 Camp Vue Terrace
El Dorado, Tunapuna
Trinidad and Tobago
Phone: (868) 663-2562
mgowrie@hotmail.com
![]()