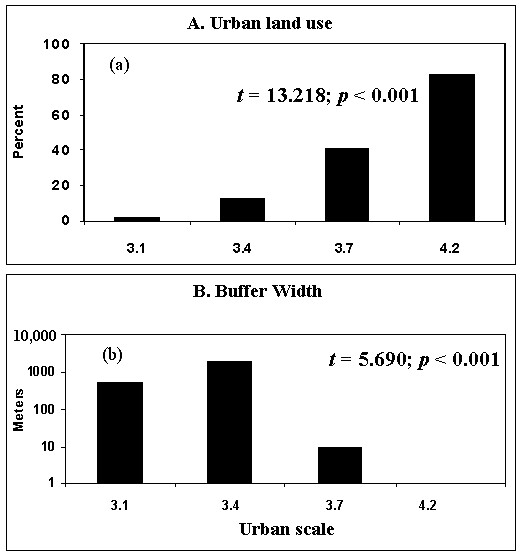
Fig. 4. Percentage urban land cover (A) and mean vegetated buffer width (B) in each of the four watersheds in this study. Student t-tests were performed on pooled data from each typology, i.e., sites 3.1 and 3.4 together vs. sites 3.7 and 4.2 together, to test H0 of no difference between typological means. The dark bars indicate that typological differences between watersheds with small-town typologies and those with suburban typologies were significant.