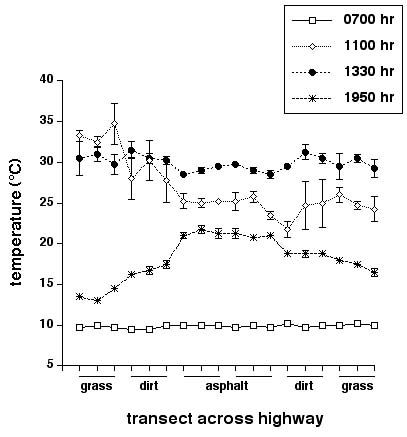
Fig. 4. Temperatures on transects across an asphalt highway near Inwood, Manitoba at four times of day. Graph shows mean values and associated standard errors for each time period based on four replicates at each of 18 equally spaced points along transects perpendicular to the highway.