NonPoint - Modeling software for: Carpenter, S.R., W.A. Brock, and P.C. Hanson. 1999. Ecological and Social Dynamics in Simple Models of Ecosystem Management. Conservation Ecology.
Chapter 5 – Governing Board
In Governing Board, two political groups of agents with different perspectives determine policy regulating pollutant input to the lake (Carpenter et al. 1999). One group, the Individualists (or Indies), favors higher phosphorus input than the other group, the Environmentalists (or Enviros). The software calculates the political influence of each group based on its apparent success in maintaining the economic and ecological condition of the system. Ecological and economic success translate into reelection and a concomitant increase in decision making power. You, the game player, influence the political decision making process and the reelection process.
Players
Scientist: The scientist (Monitoring, Assessment and Forecasting component of Carpenter et al. 1999) measures the phosphorus load to the system and the current water phosphorus levels, and makes these data, along with a model that forecasts future phosphorus levels as a function of future inputs, available to the economist (see Appendix 2 of Carpenter et al. 1999).
Economist: The economist receives data from the scientist and generates two sets of loading recommendations - one calculated using the discount rate of the Indies, and one calculated using the discount rate of the Enviros (Appendix 3 of Carpenter et al. 1999). In addition, the economist evaluates the economic impact of the most recent phosphorus load. The net economic return from polluting activity and ecosystem services influences the relative success of the Indy and Enviro agents in the next election (Appendix 5 of Carpenter et al. 1999).
Agents: Agents select their target load based on their political affiliations. The final target phosphorus load ranges between two extremes- one corresponding to the Indy beliefs, the other corresponding to the Enviro beliefs. The decision-making process can be a "winner-take-all" vote, a complete compromise in which all agent preferences are weighted equally in calculating the phosphorus input target, or some intermediate between these extremes (Appendix 6 of Carpenter et al. 1999).
Ecosystem: Once the agents set a target phosphorus load, nature introduces a random load disturbance that adjusts the target either up or down. Once the phosphorus load enters the lake, the lake responds with its intrinsic phosphorus cycling mechanisms (Appendix 1 of Carpenter et al. 1999).
You the game player: You control the collective decision parameter, which determines whether policies are made by "winner-take-all" process, complete compromise, or some intermediate weighting scheme. You also control the incumbent's advantage (the autocorrelation process in Appendix 5 of Carpenter et al. 1999) in reelection.
Creating a New Simulation
To create a simulation, simply follow these four steps.
- Select File/New from the program menu.
- Select Market manager from the list of available simulations.

- Adjust the general controls. For a detailed description of the general controls, please see Chapter 3 - The Big Picture.

- Press Go. For a detailed description of the Go and Stop/Reset controls, please see Chapter 3 - The Big Picture.
Simulation Specific Controls
In this simulation, your role as the democratic process manager allows you to influence the incumbent agents' advantage in reelection and the collective decision making process when agents determine their loading policy. Changes you make to the slide bars are immediately implemented as you release the mouse button.

Incumbent Advantage: As discussed previously, this control determines the effect of incumbency on the outcome of an election. Incumbency can be an advantage or a disadvantage.. The parameter's range is from -0.9 (incumbency is an extreme disadvantage) to 0.9 (incumbency is an extreme advantage). When the Mark box is checked, changes you make to the slide bar show as white triangles in the graphs at the following x,y coordinates: x = year, y = proportion of maximum possible incumbent advantage. You can adjust the slide bar at any time during the simulation.

Collective Decision: The value of the collective decision parameter determines the weighting function used in decision making (Appendix 6 of Carpenter et al. 1999). This control ranges from 1.0 to 5.0. One corresponds to complete compromise, in which every agent's preference is weighted equally in calculating the phosphorus input. Five corresponds to winner-take-all, in which the phosphorus input target equals the preference of a simple majority. Intermediate values give intermediate weighting schemes, in which the minority views have some degree of influence on the target input. When the Mark box is checked, changes you make to the slide bar show as red triangles in the graphs at the following x,y coordinates: x = year, y = proportion of maximum possible collective decision. You can adjust the slide bar at any time during the simulation.
Output Graphs
All output graphs run synchronously, with years being the x axis unit. All line data are plotted on the left y axis. The white and red marks are plotted on the right y axis, with the scale, ranging from zero to one, representing the proportion of maximum for the given simulation specific control.
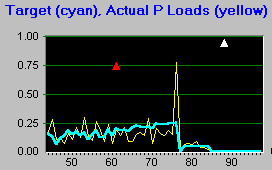
Graph 1: Target Phosphorus and Actual Phosphorus Loads

Scientists provide data about their perception of the ecological system to economists, who in turn provide loading recommendations that favor immediate payoff or longterm ecological health. The target load represents either the load chosen by the agents in power if collective decision is set to five, or the collective decisions of all agents if collective decision is set to one. Actual loads vary around the targets due to unpredictable loading phenomena, such as changes in weather. The simulation introduces stochasticity in the phosphorus load calculation.
The white and red marks indicate that the user changed incumbent advantage and collective decision, respectively. Collective decision was set to three fourths its maximum of 5 on year 60; whereas, incumbent advantage was set to its maximum of 0.9 on year 90.
Graph 2: Water Phosphorus and Net Payoff

Water phosphorus remains relatively low (<0.3) until an unusually high random phosphorus load on year 76 (see graph 1) helps kick it into its alternate stable state. This consistently high phosphorus level indicates that the lake has turned eutrophic, and its economic value suffers. Net payoff (units are adjusted to fit the y axis) takes a plunge, but begins recovery as the lake phosphorus drops from year 77 to 95 and beyond.
Graph 3: Reversibility Parameter

The reversibility parameter represents the scientist's belief that the system can recover quickly from perturbation (Appendix 3 of Carpenter et al. 1999). A value less than about 0.5 means that the scientist believes that a perturbations to the system could cause irreversible damage. As the values rise, the scientist's confidence rises in the reversibility of the ecosystem. Keep in mind that the scientist does not know the true reversibility, but is merely estimating it.
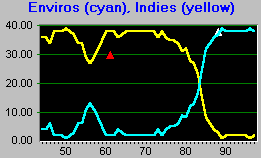
Graph 4: Enviro Agents and Indi Agents

Agent numbers change as their political success changes, and as the user controlled parameters change. On year 60 the user changed the collective decision parameter to three fourths its maximum, which heavily biases the influence of the majority party, the Indies.
On year 76 the lake phosphorus levels explode (see graph 1), and the political winds change to favor the Enviros. On year 90, the user set the incumbent advantage to its maximum, which tends to cement the incumbents political dominance (in this case the Enviros) for a few years.
Graph 5: Performance Measures

NonPoint measures your performance by calculating the percentage of days when lake phosphorus was less than one, and by calculating your cumulative payoff (values adjusted to match the scale). These measures help you to determine relative performance between simulations.
Graph 6: Mean Agent Proportions

NonPoint displays the overall mean percentages of Enviros and Indies. Through day 100 of this 300 day simulation, the Indies have dominated the political scene.

![]()


