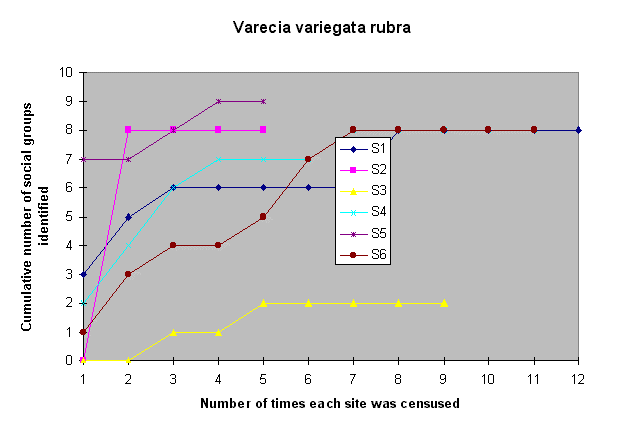
Fig. 7.
Sample effort curve for
Varecia r. rubra,
demonstrating the number of social groups that were identified after consecutive visits to the study sites.