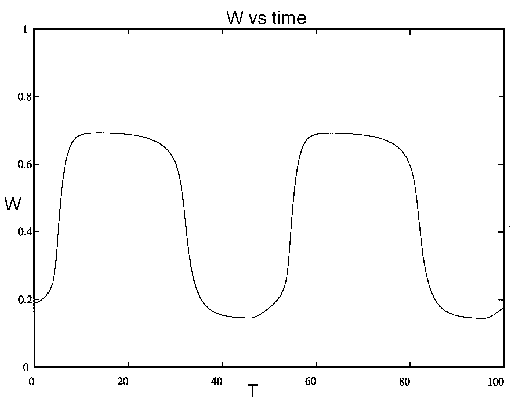
FIG. 9
. Tree density (
W
) vs. time (
T
, in years) for the system (21)-(28), including dynamics for the age variable. A similar figure could be drawn for the grass density, which tends to be high when woody vegetation is low, and vice versa.