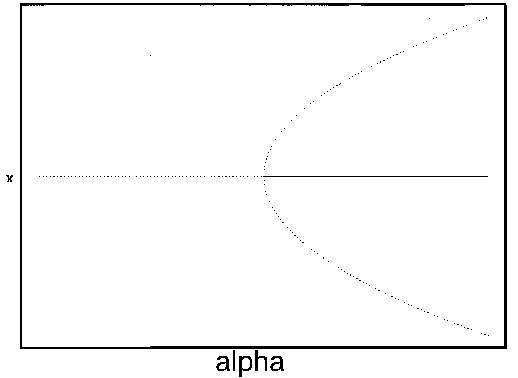
FIG. 1
. The parameter
is plotted on the horizontal axis and the corresponding equilibria in
for Eq. (2)are plotted on the vertical axis. The stable equilibrium is plotted with a solid curve, whereas unstable ones are plotted with dotted curves.
 is plotted on the horizontal axis and the corresponding equilibria in
  for Eq. (2)are plotted on the vertical axis. The stable equilibrium is plotted with a solid curve, whereas unstable ones are plotted with dotted curves.