|
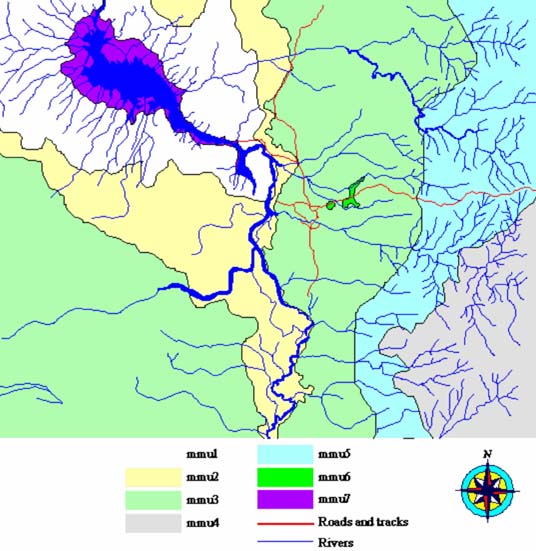
Table 6. Descriptions of the mapping units used in the vegetation map of Nhanchururu, with the vegetation types associated with each unit. NMU=Nhanchururu Mapping Unit.
|
Mapping
unit | Description | Vegetation types |
|
| NMU1 | Miombo woodlands | A1a,
A1b, A1c, A2, B2 |
| NMU2 | Millettia
stuhlmannii–Bauhinia galpinii
woodland thickets | B1 |
| NMU3 | Cultivated
lands | C1 |
| NMU4 | River | — |
|
For both village areas, the thicket and forest ecosystem types had both the highest conservation importance and the highest local livelihood importance scores. These landscape units are likely to be under the greatest threat from village-level consumptive use and, thus, are where the greatest conflict is likely to occur in terms of meeting both conservation and livelihoods needs.
Confronting Conservation Importance Scores with Local Community Importance Scores
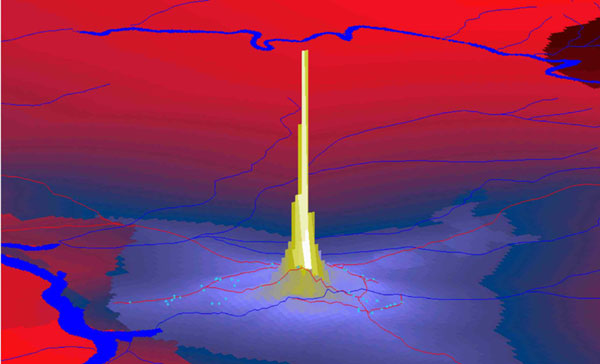
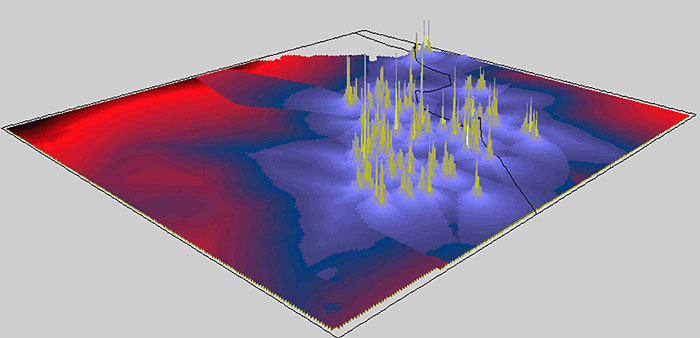
For each site, three-dimensional B:C surfaces were generated, based on the logic of the BBN models, where the x- and y- dimensions of the surfaces equated to spatial x- and y- coordinates and the z-dimension represented the B:C ratio (Figs. 8 and 9). The cost components of these surfaces can be visualized as bowls of increasing costs, with the households of the village in the center and valleys of lower cost associated with roads or pathways leaving the village. The benefit component of these surfaces was related to the vegetation maps. These maps provided simple visual representations of the importance of locations in the local landscapes. In Muaredzi, for example, the very steep costs of crossing the Urema River, and thus breeching official regulations, contribute to a steep drop-off in importance across this river boundary. With local confusion as to where the Park boundary lies in Nhanchururu, this steep change in importance is not where the Park administration believes it should be.
|
Fig. 8. Three-dimensional view of the benefit:cost (B:C) surface of the Muaredzi village area taken from the southwest. The z-axis is magnified 10 times to highlight the spatial variation in predicted landscape importance. The landscape coloring represents the predicted B:C (i.e., importance) of the landscape to local community members. Highest importance units in the landscape are those in white and gold (the peak in the center of the image). Thereafter, areas in light to darker blue and then red to dark red reflect decreasing landscape importance. The major routes and tracks are marked by thin red lines, with the households of the village marked in light blue. The blue swath of the Urema River is evident in the bottom left corner and the Muaredzi River crosses from right (east) to left (west) just to the foreground side of the village area. The two light blue patches to the east of the village area (along the main road to Muanza) are patches of dry forest that are of very high importance to the community.
|
|
Fig. 9. Three-dimensional view of the benefit:cost (B:C) surface of the Nhanchururu village area taken from the southeast. The z-axis is magnified 10 times to highlight the spatial variation in predicted landscape importance. The landscape coloring represents the predicted B:C (i.e., importance) of the landscape to local community members. Highest B:C scores are shown in white and gold, with decreasing importance scores shown by light to dark blue and then light to dark red. The black line running over the surface is the GNP boundary.
|
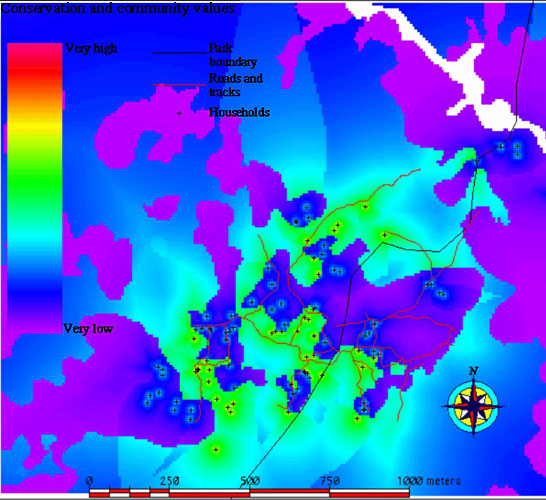
In general, the landscape units that had the highest local importance were also those of high conservation importance (Figs. 10 and 11). There were some landscape elements that were of high importance to the community (e.g., termite mounds in Muaredzi) that we were unable to map because the resolution of the data was insufficient in relation to the size of the units. These fine-scale, localized, high importance areas are not captured in the maps we generated.
|
Fig. 10. Muaredzi site, with shading showing the range in scores of the joint conservation and community use data. Major tracks, roads, and rivers are shown for reference purposes. The two highest importance patches to the east of the village area are two small dry-forest patches (Nsitu or MMU6).
|
|
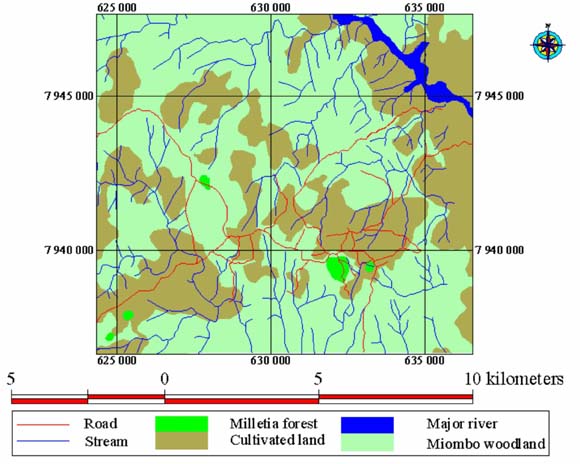
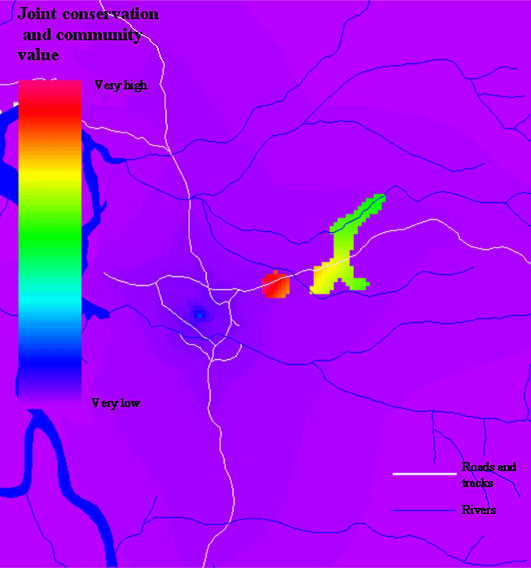
Fig. 11. Nhanchururu site, with shading showing the range in scores of the joint conservation and community use data. Major tracks and roads are shown for reference purposes. Areas with the highest joint importance (shown in light green to yellow) are generally those in close proximity to the households within the miombo vegetation type. The larger patches of mauve to dark blue are generally cultivated areas and thus have low conservation importance.
|
DISCUSSION
Implications for Land-use Planning
Community use of resource areas can be divided into two broad classes: land transformation and multiple use. Land transformation includes the conversion of woodland areas into cultivated fields or riverine gardens. This is clearly the most destructive process and directly and negatively impacts biodiversity and thus conservation objectives. Multiple use of given landscape units by the community can, however, under certain management conditions, remain compatible with conservation objectives.
The expansion of human populations in and adjacent to the Park will inevitably result in greater demands from people for agricultural land and for the resources that the Park seeks to conserve. Thus, it seems inevitable that conflict between the Park and the people whose livelihoods depend on Park's resources will intensify. Further conflict is likely to arise through the build-up of wildlife populations, such as elephants and large predators.
One possible solution for the Park management is to identify key ecosystem units, such as forest communities, and put in place fully enforced regulations governing the clearance of these areas for cultivation. Development of land-use zones, in collaboration with the affected local communities, may be one way of achieving this. Once these areas of both high conservation and high local resource importance have been identified, and their use regulated through zoning, co-management structures and institutions could be developed to provide sustainable multiple-use opportunities to those communities with a high dependency and capacity to manage these resource units.
As well, the Park management needs to develop and maintain functional relationships with these communities (i.e., relationships with low levels of conflict and high levels of cooperation), which will require significant management inputs. Maintaining the communities within the Park will incur additional costs, including both direct costs (e.g., the costs of maintaining rangers' posts in the vincinities of the communities), and indirect costs (e.g., increased fire incidence). For some areas or ecosystem units, these costs may be warranted, but for other areas they may not be. In such instances, GNP management may be better off seeking incentives to persuade communities to relocate voluntarily.
The coupling of Park ecosystems to ecosystems outside the Park (particularly hydrological couplings with Gorongosa Mountain), and thus outside the control of GNP management, means that for GNP to survive ecologically, Park management must also seek to develop fully functional co-management relationships with the local communities responsible for managing these external ecosystem elements.
Key Lessons Learned from the Process
The project developed and tested a rich and relatively rapid approach for identifying the current importance of landscape units to rural communities in central Mozambique, as well as the factors underpinning their importance. The approach was shown to be capable of using spatial data where available (i.e., through base maps or aerial photography) or site sampling where spatial data were not available.
Confrontation of the prior model with field data made it clear that the costs side of the model, and hence our prior understanding of the effects of costs on local importance scores, was weak. We expect that just as individual goods and services have different benefit values so do each of them have different costs associated with their collection or use. Therefore, future iterations of the approach should seek to improve the development of the cost side of our understanding. One thing that is not clear is whether the current techniques enabled the CRUAT to separate the costs of procuring or using benefits of a landscape unit from its overall importance assignment. For example, do people mentally calculate a net importance estimate for each location (net of the costs of procurement) or do they develop a gross
estimate and then evaluate the costs?
The development of the conservation importance scores component of the assessment was, if anything, more difficult than the local community valuations. Mostly, this was because it was much more difficult to identify whose perceptions were of consequence. There was no concentrated community to ask. In contrast, the local community, although diverse, was in one physical location
and was able to develop consensus perceptions through the processes used. Equally difficult from the conservation importance scoring perspective was the identification of importance scores for rarity or endemism. How much more important is an endemic species than a rare one?
Complete biodiversity assessments on the ground were not possible given the time and resources available. In retrospect, it would perhaps have been more efficient to use local community knowledge to develop the biodiversity estimates, using morpho-species information, rather than trying to go to species identifications. However, the problem of the importance of what to whom would still remain.
Our method was weakened because of our failure to develop and use a cross-comparative reference point or importance object. We had no absolute zero or reference point to establish the relative importance scores assigned to goods, services, or landscape units across the sites. Thus, we were limited in our ability to compare the effects of such things as tenure on the importance of landscape across the two sites.
RESPONSES TO THIS ARTICLE
Responses to this article are invited. If accepted for publication, your response
will be hyperlinked to the article. To submit a comment, follow
this link. To read
comments already accepted, follow this link.
Acknowledgments:
We gratefully acknowledge the key contributions made to the project by a wide variety of people, without whose inputs it would not have been possible to carry out the work. The CRUAT members played an essential role in the collection of field data within the two communities. For Muaredzi, we acknowledge the willing input of the following 26 informants: António Armindo, Fieda Betchane, João Botão, Inês Chuva, Rosário Diogo, Chanaze Fazenda, Mateus Fazenda,
Rosa Fazenda, Nina Fernando, Florindo Jambo, Maria Jambo, Pascua Jambo, Anita João, Augusto João, Costamina João, Diogo João, Pedro João, Tima João, Zelinha Luis, Virgínia Macamero, José Mairosse, Celina Manuel, Maria Manuel, Inês Melo, Salita Pita, and Fazenda Sixpence.
For Nhanchururu, we acknowledge the following 20 members: Cassenguere Almeida, Janita Almeida, Ricardo Almeida, Lúcia António, Anita Baptista, Eusébio Fernando, Henriques
Fernando, Pureja Fombe, Victória Francisco, José Carlos Fredi, Sarga Joalinho, Laurita João, Melita José, Pureja Matequesse, José Moises, Joalinho Murungo, Rodito Pureja, Fairita Saimone, Manuel Verniz Sandramo, and Melisa Zeca.
Accessing the community data required continual translations from Sena to Portuguese and English, and facilitation. We thank Pedro Dique Camissa, Euzebio Simao Sizinho, Reginaldo Alberto Casse, and Fatima de Jesus Pereira, and Mr. Atanasio Jujuman for capably providing these inputs.
The project would not have been possible without the logistical, technical, and moral support of Roberto Zolho, Administrator of Gorongosa National Park. We are extremely grateful to him. Brit Reichelt has consistently provided us with the most remarkable administrative support in Mozambique. We are equally grateful for the very able field assistance provided by numerous field staff of the Park, particularly those of Muaredzi and Nhanchururu Posts, who facilitated our stays in the field, and played an important role in passing communications to and from Park headquarters and in passing messages to community members.
We thank the District Administrators of Muanza and Gorongosa Districts for giving their permission to implement the project within their respective districts. In Zimbabwe, we thank the administrative staff of TREP for their ongoing support to the project; Ms. Astrid Huelin for assistance with procuring and
processing the satellite imagery, and Mr. Isau Bwerinofa for extensive assistance with digital mapping.
We gratefully acknowledge the financial support of CIFOR. We are most grateful to Wil de Jong for his continued encouragement and support, and to Doug Sheil and Miriam Van Heist for sharing their experiences from Indonesia and for contributing toward the initial shaping of the study.
Two anonymous referees provided helpful comments to improve the paper.
APPENDIX 1.
Background to Muaredzi
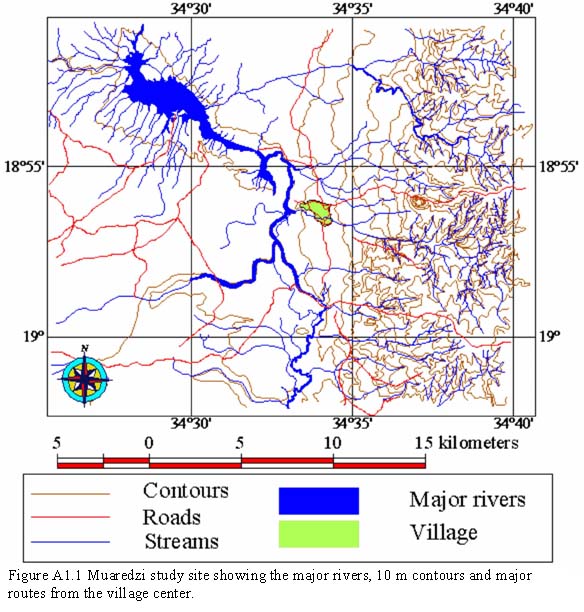
The Muaredzi community is situated on the north and south sides of the Muaredzi River where it joins the Urema River, downstream of Lake Urema (Fig. A1.1). Maunza, the nearest town, is approximately 35 km to the northeast and Chitengo, the GNP headquarters, is about the same distance to the west. There is no regular transport from Muaredzi to Maunza and, other than the occasional visit by national parks staff, very few vehicles come to the village.
The village area, comprising all households and fields, is relatively compact, being contained within an area of about 2 km2. Although we do not have a full count of people living in Muaredzi, 40 households were identified in November 2001. These were split roughly equally north and south of the Muaredzi River. The community falls under the jurisdiction of two different Regulos. Regulo Nguinha controls the area to the north of the Muaredzi River and Regulo Nhantaze controls the area to the south. Within Muaredzi, there were four Fumos1.
Residents are forbidden by park regulations to venture to the west of the Urema River. The village area does not appear to have any clear boundaries to the east, south or north.
In addition to the road to Muanza, there are two other tracks leading away from Muaredzi. One leads north for some 18 km along the edge of the Urema flood plain to Goinha (also known as Muanza Baixo). The other is a path that runs for some 5 km to the south of the village, to a crossing point on the Urema River known as Jangada. Across the river, this connects to the road to GNP headquarters at Chitengo. Before the civil war, there was a pontoon here (hence the name Jangada), but now the only means of crossing is by a dugout canoe.
The vegetation of the Lake Urema flood plain area is dominated by open grasslands. Tinley (1977) classified these into short, medium, and tall flood plain grasslands. The short grasslands comprise communities dominated by
Sporobolus spp. (particularly S. Kentrophyllus and S. Ioclados) on saline soils, and others dominated by the Cynodon dactylon and Digitaria swazilandensis lawns. The latter form the bulk of the flood plains on the south and northwest sides of Lake Urema. The medium grassland largely comprises two communities, one dominated by Setaria eylesii and the other by Echinachloa stagina. The tall grasslands are characterized by a Vetiveria nigritana community, which grows to 225 cm in height. These different grassland communities occur as a mosaic that grades into the savanna areas above the flood plain. Historically, there would have been a large biomass and diversity of herbivores associated with these grasslands but, during and after the war of independence, these populations were decimated. Only small populations of mostly smaller herbivores, such as impala, now occur in the Muaredzi area. There are, however, infrequent visits to the area by hippopotami and elephants. Tinley also noted an aquatic community based on seasonally flooded pans in the flood plain.
Tinley identified six savanna woodland types growing on the rift valley floor:
- Mixed savanna (Acacia, Albizia, Lonchocarpus, Piliostigma, Sclerocarya);
- Marginal flood plain woodland (Acacia albida, A. xanthophloea);
- Knobthorn savanna (Acacia nigrescens);
- Sand savanna (Burkea africana, Terminalia sericea);
- Mopane savanna (Colophospermum mopane);
- Palm savanna (Hyphaene benguellensis, Borasus aethiopica).
Tinley also identified four thicket types and two forest types from the valley floor area. All thicket types (riverine, alluvial fan, tree-base, and termitaria thickets) appear to occur in the Muaredzi area, but the forest types appear to
be absent.
As it is situated within the national park, the village is exposed to wildlife. Elephant move within the village area and surrounds and clearly do cause some destruction to crops. A number of smaller animals are also commonly seen
close to the village, including nyala, impala, bushbuck, oribi, warthog, and wild pig. Lake Urema is reported to harbor a healthy population of crocodiles, and hippos are also present.
Background to Nhanchururu
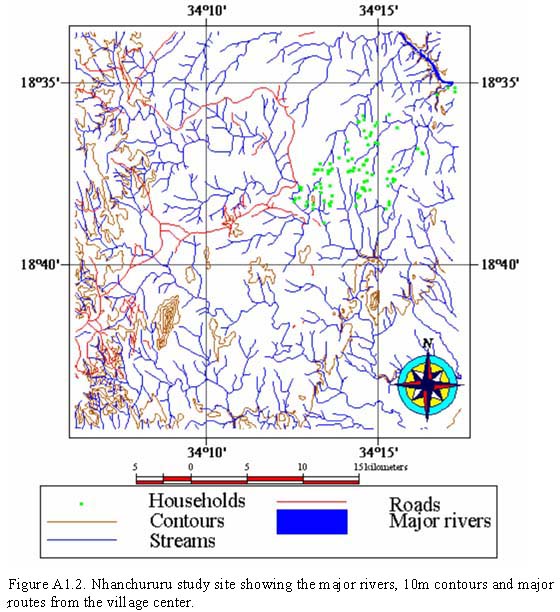
The Nhanchururu site is situated astride the western boundary of GNP, some 15 km southeast of Gorongosa Mountain, and some 25 km northeast of Villa Gorongosa (Fig. A1.2). It is part of the Barue Plateau, the altitude of which varies between about 200 and 340 m above sea level. The terrain is deeply dissected, with rivers draining south to the Mucodza River and north or northeast to the Vunduzi River. The community lies on the upper portion of the rift escarpment, on the watershed between the Mucodza and Vunduzi Rivers.
The vegetation of the Nhanchururu area is largely miombo savanna woodland, but with some evergreen thickets on the deeper sands of the interfluve crests. The dominant woodland species are Brachystegia boehmii, B. spiciformis, Erythrophloeum africanum, Julbernardia globiflora, and Pterocarpus angolensis. There are some narrow patches of thick riverine forest along the Vunduzi and Mucodza Rivers but these are very limited in extent.
Sketch maps drawn by community members provided more specific background data for Nhanchururu. The village area is roughly rectangular in shape, about 10 km south to north and 8 km east to west. Nhanchururu is bounded to the east by the national park, to the west by Nhangeia village, to the south by Nhanthemba village, and to the north by Safumira village. The boundaries with adjacent villages appear to be reasonably clear. These comprise the Mucodza River to the south, the Vunduzi River to the north, and a minor drainage called the Rio Nhachituzui to the west.
To the east, the boundary between the village and the park is less clear. The community members were adamant that the entire village was outside of the park, and that the park started immediately to the east of the village, with the
boundary being marked by a line of low hills and the small Rio Nhachiru. However, at the approach to the village along the main access road from the west, shortly after entering the village area, there is an official sign stating that one is now entering Gorongosa National Park. According to this, the bulk of the village falls within the national park. Regardless of this situation, the community members seemed to feel much more secure than the Muaredzi residents, and there was never any suggestion of fears that the park may in future attempt to move them.
In terms of roads and major paths, the main access road follows the watershed between the Vunduzi and Mucodza Rivers, bisecting the village into southern and northern portions. It leads through the village to the Rangers' post, and then continues east into the park (and in former times apparently all the way through to Chitengo). There were no other significant tracks to the east. To the south, there are two routes that cross the Mucodza River, both of which are
located towards the western end of the village. One of these is a shortcut to Villa Gorongosa, if traveling by foot or bicycle. As far as vehicles are concerned, this route appears not to have been used for some time, is in a very poor state of repair, and the crossing over the Mucodza would not be passable until late into the dry season. To the west, in addition to the main access road, there is one other footpath that crosses the Rio Nhachituzui and continues to the neighboring village. To the north, there are a number of routes that lead off the main access road towards the Vunduzi River. Two of these reach to the Vunduzi, but neither appears to cross the river.
A total of 107 households were identified within the village, split roughly equally to either side of the main access road. Households tend to be scattered individually rather than clumped. Nhanchururu has four fumos. Of these, Fumo Almeida appears to be the most influential, and the other three of lesser significance. The responsible Regulo lives outside of the village to the south of the Mucodza River.
People were moved from the rift valley areas of Gorongosa National Park in the 1950s to the Barue plateau area, including what is now Nhanchururu. Further disruptions and movements occurred during the war for independence and the subsequent period of continued fighting.
1Fumos are the next level of traditional leadership down from the Regulo.
APPENDIX 1
Background
to Muaredzi
The
Muaredzi community is situated on the north and south sides of the Muaredzi
River where it joins the Urema River, downstream of Lake Urema (Figure A1.1).
Maunza, the nearest town, is approximately 35km to the north east and Chitengo
the GNP headquarters is about the same distance to the west. There is no
regular transport from Muaredzi to Maunza and, and other than the occasional
visit by national parks staff, very few vehicles come to the village.
The
village area, comprising all households and fields, is relatively compact,
being contained within an area of about 2 km by 2 km. Although we do not have a
full count of people living in Muaredzi, 40 households were identified in
November 2001. These were split roughly equally north and south of the
Muaredzi River. The community falls under the jurisdiction of two different
Regulos.
Regulo
Nguinha controls the area to the north of the Muaredzi River and
Regulo
Nhantaze
controls the area to the south. Within Muaredzi there were four
Fumos[1].
Residents
are forbidden by park regulations to venture to the west of the Urema River.
The village area does not appear to have any clear boundaries to the east,
south or north.
In
addition to the road to Muanza, there are two other tracks leading away from
Muaredzi. One leads north for some 18 km along the edge of the Urema flood
plain to Goinha (also known as Muanza Baixo). The other comprises a path,
which runs for some 5 km to the south of the village, to a crossing point on
the Urema River known as Jangada. Across the river, this connects to the road
to GNP headquarters at Chitengo. Before the civil war there was a pontoon here
(hence the name Jangada), but now the only means of crossing is by a dugout
canoe.
The
vegetation of the Lake Urema flood plain area is dominated by open grasslands.
Tinley (1977) classified these into short, medium and tall flood plain
grasslands. The short grasslands comprise communities dominated by
Sporobolus
spp.
(particularly
S.
Kentrophyllus
and
S.
Ioclados
)
on saline soils, and others dominated by the
Cynodon
dactylon
and
Digitaria
swazilandensis
lawns. The latter form the bulk of the flood plains on the south and north west
sides of Lake Urema. The medium grassland largely comprises two communities -
one dominated by
Setaria
eylesii
and the other by
Echinachloa
stagina
.
The tall grasslands are characterized by a
Vetiveria
nigritana
community,
which grows to 225cm in height. These different grassland communities occur as
a mosaic that grades into the savanna areas above the flood plain. Historically
there would have been a large biomass and diversity of herbivores associated
with these grasslands, but during and after the war of independence these
populations were completely decimated. Only small populations of mostly smaller
herbivores such as impala now occur in the Muaredzi area. There are however,
infrequent visits to the area from hippopotami and elephants. Tinley also noted
an aquatic community based on seasonally flooded pans in the flood plain.
Tinley
identified six savanna woodland types growing on the rift valley floor:
Mixed
savanna (
Acacia,
Albizia, Lonchocarpus, Piliostigma, Sclerocarya
);
Marginal
flood plain woodland (
Acacia
albida, Acacia xanthophloea
);
Knobthorn
savanna (
Acacia
nigrescens
);
Sand
savanna (
Burkea
africana, Terminalia sericea
);
Mopane
savanna (
Colophospermum
mopane
);
Palm
savanna (
Hyphaene
benguellensis, Borasus aethiopica
).
Tinley
also identified four thicket types and two forest types from the valley floor
area. All thicket types (riverine, alluvial fan, tree-base and termitaria
thickets) appear to occur in the Muaredzi area, but the forest types appear to
be absent.
Being
situated within the national park, the village is exposed to wildlife.
Elephant move within the village area and surrounds, and clearly do cause some
destruction to crops. A number of smaller animals were also commonly seen
within close proximity to the village, including nyala, impala, bushbuck,
oribi, warthog and wild pig. Lake Urema is reported to harbor a healthy
population of crocodiles, and hippos are also present.
Background
to Nhanchururu
The
Nhanchururu site is situated astride the western boundary of GNP, some 15 km to
the south east of Gorongosa Mountain, and some 25 km north east of Villa
Gorongosa (Figure A1.2). It comprises part of the Barue Plateau, the altitude
of which varies between about 200 and 340 metres above sea level. The terrain
is deeply dissected, with rivers draining south to the Mucodza River and north
or north-east to the Vunduzi River. The community is therefore on the upper
portion of the rift escarpment, and on the watershed between the Mucodza and
Vunduzi Rivers.
The
vegetation of the Nhanchururu area is largely miombo savanna woodland, but with
some evergreen thickets on the deeper sands of the interfluve crests. The
dominant woodland species are
Brachystegia
boehmii
,
B.
spiciformis
,
Erythrophloeum
africanum
,
Julbernardia
globiflora
,
and
Pterocarpus
angolensis
.
There are some narrow patches of thick riverine forest along the Vunduzi and
Mucodza Rivers but these are very limited in extent.
Sketch
maps drawn by community members provided more specific background data for
Nhanchururu. The village area is roughly rectangular in shape, some 10 km
south to north and some 8 km east to west. Nhanchururu is bounded to the east
by the national park, to the west by Nhangeia village, to the south by
Nhanthemba village and to the north by Safumira village. The boundaries with
adjacent villages appear to be reasonably clear. These comprise the Mucodza
river to the south, the Vunduzi river to the north and, to the west, a minor
drainage called the Rio Nhachituzui.
To
the east, the boundary between the village and the park is less clear. The
community members were adamant that the entire village was outside of the park,
and that the park started immediately to the east of the village, with the
boundary being marked by a line of low hills and the small Rio Nhachiru.
However, as one approaches the village along the main access road from the
west, shortly after entering the village area one encounters an official sign
stating that one is now entering Gorongosa National Park. According to this
the bulk of the village falls within the national park. Regardless of this
situation, the community members seemed to feel much more secure than the
Muaredzi residents, and there was never any suggestion of fears that the park
may in future attempt to move them.
In
terms of roads and major paths, the main access road follows the watershed
between the Vunduzi and Mucodza rivers, bisecting the village into southern and
northern portions. It leads through the village to the rangers post, and then
continues east into the park (and in former times apparently all the way
through to Chitengo). There were no other significant tracks to the east. To
the south, there are two routes that cross the Mucodza River, both of which are
located towards the western end of the village. One of these comprises a
shortcut to Villa Gorongosa if traveling by foot or bicycle. As far as
vehicles are concerned this route appears not to have been used for some time,
is in a very poor state of repair, and the crossing over the Mucodza would not
be passable until late into the dry season. To the west, in addition to the
main access road, there is one other footpath that crosses the Rio Nhachituzui
and continues to the neighboring village. To the north there are a number of
routes that lead off the main access road towards the Vunduzi River. Two of
these reach to the Vunduzi, but neither of them appears to cross the river.
A
total of 107 households were identified within the village, these being split
roughly equally to either side of the main access road. Households tend to be
scattered individually rather than clumped. Nhanchururu includes four
fumos.
Of these,
Fumo
Almeida appears to be the most influential, and the other three of lesser
significance. The responsible
Regulo
lives outside of the village to the south of the Mucodza River.
People
were moved from the rift valley areas of Gorongosa National Park in the
1950’s to the Barue plateau area, including what is now Nhanchururu.
Further disruptions and movements occurred during the war for independence and
the subsequent period of continued fighting.
[1]Fumos are
the next level of traditional leadership down from the
Regulo.
APPENDIX 2.
Participatory Research Methods
The same approach was followed for both sites: a traditional ceremony was held first, followed by an open community meeting; then, a representative group of community informants (community resource use assessment
team, or CRUAT) was selected, a modus operandi was established with the informant group and, thereafter, the process of data collection was begun. For Muaredzi, this was achieved over a series of three field trips (September 2001, November 2001, and April 2002). For Nhanchururu, the traditional ceremony was held in April 2002 and the remainder of the activities and collection of community livelihood data were carried out during a single field trip in May 2002.
The initial community meetings provided an opportunity to explain the aims and needs of the project to those present. The community members were told that the project team sought an improved understanding of household and community livelihoods. We explained that we wished to work with a limited group of informants, and that these informants should be representative of the major socio-economic groups within the community. These representatives would form the CRUAT. In Muaredzi, the CRUAT comprised 14 men and 8 women; in Nhanchururu, 10 men and 8 women.
Three basic tools were used to conduct the analysis: spidergrams, sketch mapping, and open discussion. As each of these have been described in detail elsewhere (Lynam 1999, 2001), they are not described here.
Model Development
In the initial model, the importance of a landscape unit to the community was expressed as a simple ratio of benefits to costs (i.e., benefits divided by costs—B:C). Thus, the larger the B:C ratio, the more important the landscape unit or location was expected to be. The benefit side of the model was defined as a function of three inputs: i) the relative importance or preference for each of the goods and services (GS) derived from a given landscape unit or location; ii) the number of such GS; and iii) the density of GS per unit area in the landscape unit. Thus, the gross benefit derived from a unit of the landscape was a simple weighted sum of the importance score and density across all GS (Eq. 1).
 [1]
Where:
B = the total, gross benefit derived from a landscape unit or element;
Pi = the preference weighting (RIW) for a good or servicei;
Di = the density of a good or service i, where density ranges between 0 (none) and 1 (maximum).
The cost component of the model was deemed to be a function of three major cost sources. First, the distance traveled to obtain the good or service, where this distance was the weighted sum of distances along major routes and distances off routes. The off-route distances would be more costly. The second cost source was physical barriers, such as rivers, wetlands or steep terrain. The third cost-contributing source was the institutional barriers or rules and regulations governing access to a given resource or landscape unit. This latter group was complicated by the elements associated with institutional costs—in the context of this project, the probability of transgressions being discovered and then the associated fine or punishment for deviations. This was simplified in the model to reflect only an opportunity cost associated with regulations—the resource use opportunities forgone due to the regulations.
The conceptual model defined our expectations of the determinants of landscape importance. Explicitly, the expectations derived from the model were that the importance of landscape units would be highest where there were multiple goods and services of high importance that were not governed by limiting institutions, which were close to the household or community, and which had no barriers impeding access. Landscape units or locations of low importance would occur under the reverse conditions.
A computer implementation of the model was developed as a Bayesian Belief Network (BBN) using Netica (www.norsys.com).
Refinement of the Model
Information obtained from the CRUATs was subsequently used to shape and update the model for each study site. In particular, this enabled the detailing of goods, services, and cost functions for each site, and the assignment of relative weights to each of these factors. The result was the development of specific prior models for either site. These models were at a stage where, when information regarding the status of each of the peripheral nodes (goods and services and cost functions) for a particular point location was input, the model would provide an estimate of the most probable landscape importance for that location.
Field Sampling for Model Confrontation
The final step in terms of collection of field data was to carry out a sampling process, in order to generate field data with which to confront the model, and to provide the basis for further refinement and updating of the model. The general approach was to visit a number of locations within each village, together with CRUAT members and, for each location, to record their scores for each of the goods and services present at the site, for all cost factors, and then an overall landscape unit importance score. The scores for goods and services and for cost factors were subsequently fed into the model, and the model then generated an estimated value for each sample. These estimates were then compared with the CRUAT importance scores for each sample.
In order to increase the number of samples possible within the available time, the CRUAT group at each site was split into three or four subgroups. Each subgroup comprised several community members, plus a data recorder (facilitator). For Muaredzi, each subgroup comprised two men and four women; for Nhanchururu, two men and two women.
Sampling was done along line transects. Each subgroup covered a single transect per day. Transects were selected based on overall coverage of each village area, coupled with logistical constraints, notably the existence of potential access paths and roads (the start and end points for each transect needed to be accessible by path or road). The length of transects was decided according to the estimated time available for sampling, i.e., total working time of 6 hours each day, less time required to travel to the starting point and to return from the end point. Lengths varied from about 1.5 to 4.5 km. The sampling interval and number of samples per transect were decided in the field, once at the starting point for each transect, and were based on the estimated time available for sampling and the time it was likely to take to traverse the transect. Sampling intervals ranged from about 250 to 600 m and the number of samples per transect from four to 12.
Transects covered the principal land types within each area, and all different combinations of distances along paths and off paths (as the prior versions of the model had shown a high sensitivity to these parameters). Actual positions were first selected on satellite imagery. Thereafter, the coordinates of the start and end points were read off the GIS maps and entered into GPS units.
Sample areas were circles, roughly 30 m in radius (i.e., 0.28 ha in extent). When a group arrived at a sample point, they scored the necessary factors based on consideration of the resources, etc. apparent within a 30-m radius. Sample areas were not systematically searched either before, or during, the scoring.
Scoring of landscape values was open ended, and relative to the least important locality within the village area, which was allocated a score of one point. For either site, the reference point of lowest importance was identified at the outset of the sampling process, by the entire CRUAT group together. For Muaredzi, the CRUAT identified a certain occurrence of chipale, known as nteca, as being the site of lowest value. For Nhanchururu, the CRUAT identified a certain range of hills within the national park area as being the lowest value. CRUAT members reported that they were familiar with these sites and the types of resources to be found there. However, in neither case had all the informants, particularly the women, ever been to these places, nor did they visit them as part of this exercise.
For Muaredzi, a total of 75 samples was recorded from ten transects over a 3-day period. For Nhanchururu, 82 samples were obtained from 13 transects, recorded over 7 days. There are several reasons for the lower rate of sampling for Nhanchururu compared with Muaredzi: Nhanchururu was the first site sampled and the procedure was still unfamiliar; the terrain was more difficult (broken and hilly); and rain caused disruptions.
Updating the Models
Field sample data were subsequently entered onto a spreadsheet to form a case file for each site. Each case file consisted of the total number of samples (75 for Muaredzi and 82 for Nhanchururu), with each sample having scores for all goods and services and for all cost factors. Based on these data, the model generated estimated landscape values for each sample location. These values were then compared with the values given for each sample by the CRUAT members.
The case files were then used to confront the models for each site. In each case, the models were first confronted with the data in the case files, and the same case files were then used to update the probability structure of the model. The
resulting (posterior) models were subsequently used to explore the sensitivity of the models to the collection of further information for each node, and also to explore the implications of the understanding gained for land-use planning
and policy decision making.
Spatial Data Analysis
The extent of the sample area for each site was selected based on initial discussions with the Muaredzi community on how far they traveled to collect or use resources, together with subsequent discussions among the research team. For both sites, this comprised a square, centered on each respective community, and 20 km on a side (giving a total sample area of 400 km2 for either site). These areas dictated the extent of the vegetation assessments and the development of spatial data sets for the two sites.
Topographic maps at 1:250 000 and 1:50 000 were obtained from the Mozambique government, and data sets were digitized within the 400-km2 area around either community. The 1:50 000 maps were based on rather old air photography from 1958 to 1960. Additional data were obtained through field mapping using a number of handheld Garmin GPS units (using the WGS 84 datum). For both sites, the positions of households and all major roads and paths were recorded.
As far as possible, the BBN models developed for each site were used to guide the generation of final landscape importance maps for each site. Although the calculations for generating the final maps were simplifications of the
calculations used in the models, the general approach and principles were the same; the final landscape importance maps were developed as ratios of the benefits to the costs. Benefits were calculated as the weighted sum of scores of
the benefits that the CRUATs identified as derived from each vegetation type. The weightings were the CRUAT relative importance weights (RIW) as used in the BBN. For each site, the developed vegetation maps were converted into raster maps with square cells. These dimensions were selected because they were the same size as the sample plots for field confrontation.
The cost maps were a little more difficult to generate. First, the distance from household cost raster was generated as a buffer raster of distance from the households noted in each site. The distance classes that were used were the
same as those used in the field confrontation estimates. As in the BBN, distances were estimated along paths and assigned cost values based on the proportional costs allocated to this distance function by the CRUAT at each site. Then, distance from paths was estimated using a buffer from the mapped paths (these were mapped using handheld GPS units and the results converted into vectors). Again, the distance classes developed in the field were used to
assign costs to these buffers. The total distance cost was then estimated as the sum of the costs of the on-path and off-path distance maps.
APPENDIX 2
Participatory
research methods
The
same approach was followed for both sites, this being to first hold a
traditional ceremony; then to hold an open community meeting; to select a
representative group of community informants (community resource use assessment
team, or CRUAT); to establish a modus operandi with the informant group and,
thereafter, to proceed with the process of data collection. For Muaredzi this
was achieved over a series of three field trips (September 2001, November 2001,
and April 2002). For Nhanchururu the traditional ceremony was held in April
2002, and the remainder of the activities and collection of community
livelihood data were carried out during a single field trip in May 2002.
The
initial community meetings provided opportunity to explain the aims and needs
of the project to those present. The community members were told that the
project sought an improved understanding of household and community
livelihoods. It was also explained that we wished to work with a limited group
of informants, and that these informants should be representative of the major
socio-economic groups within the community. These representatives would form
the CRUAT. In Muaredzi the CRUAT comprised 14 men and 8 women and in
Nhanchururu 10 men and 8 women.
Three
basic tools were used for the analysis that was conducted - spidergrams, sketch
mapping and open discussion. As each of these have been described in detail
elsewhere (Lynam, 1999; 2001) they will not be described here.
Model
development
In
the initial model the importance of a landscape unit to the community was
expressed as a simple ratio of benefits to costs (i.e. Benefits divided by
costs - B/C). Thus the larger the B/C ratio the more important the landscape
unit or location was expected to be. The benefit side of the model was defined
as a function of three inputs: i) the relative importance or preference for
each of the goods and services (GS) derived from a given landscape unit or
location; ii) the number of such GS; and iii) by the density of GS per unit
area in the landscape unit. Thus the gross benefit derived from a unit of the
landscape was a simple weighted sum of the importance score and density across
all GS (Equation 1).
B
= ? (P
i
* D
i) Equation
1
Where:
B
= the total, gross benefit derived from a landscape unit or element;
Pi
= the preference weighting (RIW) for good or service
i;
Di
= the density of good or service
i,
where density ranges between 0 (none) and 1 (maximum).
The
cost component of the model was deemed to be a function of three major cost
sources. Firstly, the distance traveled to obtain the good or service, where
this distance was the weighted sum of distances along major routes and
distances off-routes. The off-route distances would be more costly. The
second cost source was physical barriers such as rivers, wetlands or steep
terrain. The third cost contributing source comprised the institutional
barriers or rules and regulations governing access to a given resource or
landscape unit. This latter group was complicated by the elements associated
with institutional costs - in the context of this project the probability of
transgressions being discovered and then the associated fine or punishment for
deviations. This was simplified in the model to reflect only an opportunity
cost associated with regulations - the resource use opportunities forgone due
to the regulations.
The
conceptual model defined our expectations of the determinants of landscape
importance. Explicitly the expectations derived from the model were that the
importance of landscape units would be highest where there were high
importance, multiple goods and services that were not governed by limiting
institutions, which were close to the household or community, and where there
were no barriers impeding access. Low importance landscape units or locations
would occur under the reverse conditions.
A
computer implementation of the model was developed as a Bayesian Belief Network
(BBN) using Netica (
www.norsys.com).
Refinement
of the model
Information
obtained from the CRUATs was subsequently used to shape and update the model
for each study site. In particular, this enabled the detailing of both goods
and services and also cost functions for each site, and the assignment of
relative weights to each of these factors. The result was the development of
specific prior models for either site. These models were thereby at a stage
whereby through inputting information regarding the status of each of the
peripheral nodes (goods and services and cost functions) for a particular point
location, the model would provide an estimate of the most probable landscape
importance for that location.
Field
sampling for model confrontation
The
final step in terms of collection of field data was to carry out a sampling
process, in order to generate field data with which to confront the model, and
to provide the basis for further refinement and updating of the model. The
general approach was to visit a number of locations within each village,
together with CRUAT members and, for each location, to record their scores for
each of the goods and services present at the site, for all cost factors, and
then an overall landscape unit importance score. The scores for goods and
services and for cost factors were subsequently fed into the model, based on
which the model generated an estimated value for each sample. These estimates
were then compared to the CRUAT importance scores for each sample.
In
order to increase the number of samples possible within the available time, the
CRUAT group at each site was split into three or four subgroups. Each subgroup
comprised several community members, plus a data recorder (facilitator). For
Muaredzi, each subgroup comprised two men and four women, whilst for
Nhanchururu the subgroup composition was two men and two women.
Sampling
was done along line transects. Each subgroup would cover a single transect per
day. The placement of transects was selected on the basis of providing overall
coverage of each village area, coupled with logistical constraints, notably the
existence of potential access paths and roads, (the start and end points for
each transect needed to be accessible by path or road). The length of
transects was decided according to the estimated time available for sampling
i.e. total working time of six hours per day, less time required to travel to
the starting point and to return from the end point. Lengths varied from about
1.5km to 4.5km. The sampling interval and number of samples per transect were
decided in the field, once at the starting point for each transect, and were
based on the estimated time available for sampling and the time it was likely
to take to traverse the transect. Sampling intervals ranged from about 250 to
600m and the number of samples per transect from 4 to 12.
The
placement of transects was decided so as to cover the principal land types
within each area, and all different combinations of distances along paths and
off paths (since the prior versions of the model had shown a high sensitivity
to these parameters). Actual positions were first selected on satellite
imagery. Thereafter, the co-ordinates of the start and end points were read
off the GIS maps and entered into GPS’s.
Sample
size was taken as being a circle, roughly 30m in radius (i.e. 0.28 ha in
extent). The group would arrive at a sample point, and then score the
necessary factors based on consideration of the resources etc. apparent within
a 30m radius. Sample areas were not systematically searched either prior to,
or during, the scoring.
Scoring
of landscape values was open ended, and relative to the least important
locality within the village area, which was allocated a score of one point.
For either site, the reference point of lowest importance was identified at the
outset of the sampling process, and by the entire CRUAT group together. For
Muaredzi, the CRUAT identified a certain occurrence of chipale, known as nteca,
as being the site of lowest value. For Nhanchururu, the CRUAT identified a
certain range of hills within the national park area, as being the lowest
value. CRUAT members reported that they were familiar with these sites, and
the types of resources to be found there. However, in neither case had all the
informants, particularly the women, ever been to these places, and nor were
they visited as part of this exercise.
For
Muaredzi, a total of 75 samples were recorded from 10 transects, over a three
day period. For Nhanchururu, 82 samples were obtained from 13 transects,
recorded over seven days. The lower rate of sampling for Nhanchururu as
compared to Muaredzi was a result of starting here and being less familiar with
the procedure; of the more difficult (broken and hilly) terrain; and of
disruptions due to rain.
Updating
the models
Field
sample data was subsequently entered onto a spreadsheet to form a case file for
each site. Each case file consisted of the total number of samples (75 for
Muaredzi and 82 for Nhanchururu), with each sample having scores for all goods
and services and for all cost factors. Based on this data, the model generated
estimated landscape values for each sample location. These values were then
compared against the values given for each sample by the CRUAT members.
The
case files were then used to confront the models for each site. In each case
the models were first confronted with the data in the case files, and the same
case files were then used to update the probability structure of the model. The
resulting (posterior) models were subsequently used to explore the sensitivity
of the models to the collection of further information for each node, and also
to explore the implications of the understanding gained for land use planning
and policy decision making.
Spatial
data analysis
The
extent of the sample area for each site was selected on the basis of initial
discussions with the Muaredzi community on how far they traveled to collect or
use resources, together with subsequent discussions among the research team.
For both sites this comprised a square, centered on the respective community,
and 20km on a side (giving a total sample area of 400km
2
for either site). These areas dictated the extent of the vegetation
assessments and the development of spatial data sets for the two sites.
Topographic
maps at 1:250,000 and 1:50,000 were obtained from the Mozambique government,
and data sets were digitized within the 400km
2
area around either community. The 1:50,000 maps were based on rather old air
photography of 1958 to 1960. Additional data was obtained through field mapping
using a number of handheld Garmin GPSs (using the WGS 84 datum). For both
sites, the positions of households, and of all majoroads and paths, were
recorded.
As
far as was possible the BBN models developed for each site were used to guide
the generation of final landscape importance maps for each site. Although the
calculations for generating the final maps were simplifications of the
calculations used in the models the general approach and principles were the
same; the final landscape importance maps were developed as ratios of the
benefits to costs. Benefits were calculated as the weighted sum of scores of
the benefits that the CRUAT identified as being derived from each vegetation
type. The weightings were the CRUAT relative importance weights (RIW) as used
in the BBN. For each site the developed vegetation maps were converted into
raster maps with square cells. These dimensions were selected because they were
the same size as the sample plots for field confrontation.
The
cost maps were a little more difficult to generate. Firstly the distance from
household cost raster was generated as a buffer raster of distance from the
households noted in each site. The distance classes that were used were the
same as those used in the field confrontation estimates. As in the BBN
distances were estimated along paths and assigned cost values based on the
proportional costs allocated to this distance function by the CRUAT in each
site. Then distance from paths was estimated using a buffer from the mapped
paths (these were mapped using handheld GPS’s and the results converted
into vectors). Again the distance classes developed in the field were used to
assign costs to these buffers. The total distance cost was then estimated as
the sum of the costs of the on path and off path distance maps.
APPENDIX 3.
Assessments of Biodiversity: Vegetation Diversity and Valuation
Landsat images (Scene 167/73; 22 August 1999) and aerial photographs were interpreted by carefully examining paper copies, as well as on-screen images. The study areas were initially demarcated on the image to form a 10 x 10 km square but were revised according to boundaries indicated by communities in the respective areas. Image and aerial photograph interpretation was used to produce preliminary vegetation associations evident from differences in color and texture on the aerial photographs and images. This formed the basis upon which the vegetation was stratified and enabled sampling within each vegetation stratum. Field work was carried out in the Muaredzi area between 3 and 14 September 2001, and in the Nhanchururu area between 6 and 18 May 2002. Ground truthing of vegetation boundaries and further assessments were done between 8 and 19 April 2002 in the Muaredzi area. The ground-truthing exercise was deemed unnecessary for Nhanchururu because of the simplicity of the mapping units.
Vegetation survey
In Muaredzi, four main transects covering the area were identified according to the directions of the main access roads. Taking the Rangers’ Post as a reference point, these were: the track toward the confluence of the Urema and
Muaredzi Rivers (western direction); the road toward Goinha village (northern direction); the road toward Muanza town (eastern direction); and the road toward the Urema crossing to Chitengo (southern direction). In addition, a number of smaller access tracks were followed but much of the inventory was done along the main roads. The positioning of the roads seemed to adequately cover much of the variation in the vegetation evident on the Landsat image.
In Nhanchururu, there was better access to places compared with Muaredzi. The former site, with its widely scattered homesteads, had more tracks and paths branching through the area, allowing better access to sample areas. A number of these paths were followed and assessments of vegetation done.
For both sites, a plot-less sampling procedure similar to that of Timberlake et al. (1993) was followed when inventorying the vegetation. Sites were selected within the stratified zones according to how representative they were of the vegetation type under consideration. At each site, a starting point was randomly selected and a circular area covered around this central point, recording all plant species until no new species were encountered within the defined area, which was usually between 0.25 and 0.5 ha, depending on species richness. This approach follows the concept of the species-area curve (Connor and McCoy 1979), which ensures that an adequate area to record all species is sampled. Care was taken to avoid roadside margins and to ensure that no obvious environmental boundaries were traversed to avoid straying into different vegetation units. A cover abundance value for each species was estimated according to the Braun-Blanquet scale (Mueller-Dombois and Ellenberg 1974). Average heights of the canopy, sub-canopy, shrub, and grass layers were estimated and the dominant species noted. Forty-seven sample points (including nine on termite mounds) were inventoried in Muaredzi and 50 sample points (including five on termite mounds) were inventoried in Nhanchururu. In addition, notes were taken at various other points at the two sites. The location of each sample point was entered into a global positioning system.
Data analyses
Hierarchical Cluster Analysis (HCA) using average linkage method (van Tongeren 1995) was performed on a matrix of 47 plots by 228 species for Muaredzi, and a matrix of 50 plots by 246 species for Nhanchururu, using species cover-abundance data. This was done to produce a classification of the vegetation based on floristic and structural similarities/dissimilarities among them. The HCA was performed using MINITAB version 13.1 statistical software (Minitab Inc. 2000). Detrended Correspondence Analysis (DCA) (ter Braak 1986, 1995; Gauch 1982), an indirect gradient analysis technique, was performed on species cover abundance data to elucidate relationships among the various plant associations and underlying environmental gradients. CANOCO Version 4 for Windows package (ter Braak 1988,
1991; ter Braak and Smilauer 1997) was used for this analysis. CANODRAW package, available in CANOCO, was used to calculate the Shannon diversity and richness indices (Ludwig and Reynolds 1988, Magurran 1988) for each inventoried site. The absolute richness values for each site were calculated as the total number of species recorded at the site.
The conservation importance value (CIV) for each map unit was calculated by multiplying the relative abundance value (RAV) of the unit by its mean diversity index (MDI), and then weighting the value obtained through multiplying by the relative proportion of unique/important plant species found within the unit (rpspp). Thus CIV=RAV*MDI*rpspp. The relative abundance value for each map unit was calculated using the formula RAV = 1- (map unit area/total area). The total area excluded water bodies. This approach is justified as, the smaller the area, the higher the priority for conservation (Timberlake et al. 1993). The MDI comprises the mean diversity value for all the sites that make up each unit. Use of the MDI alone in the calculation of the conservation importance values is justified, on the basis that the diversity index takes into account both species richness and evenness (Magurran 1988). The number of important species was expressed on a scale of 1–5, where no important species = 1; 1–2 species = 2; 3–4 species = 3; 5–6 species = 4; and >6 species = 5. Rpspp scores for each unit were derived by dividing the scale value (1–5) by the highest scale value (5). Finally, standardized conservation values were calculated for each unit by dividing the CIV by the highest CIV, thus giving values between zero and one. Water or river systems were arbitrarily assigned conservation values of 0.0001.
LITERATURE CITED
Campbell, B. M., J. Clarke, M. Luckert, F. Matose, C. Musvoto, and I. Scoones. 1995. Local-level economic valuation of savanna woodland resources: village cases from Zimbabwe. Hidden Harvest Project Research Series 3. International Institute for Environment and Development, London, UK.
Connor, E. F., and E. D. McCoy. 1979. The statistics and biology of the species–area relationship. American Naturalist 113:791–833.
Costa, P., and F. Vogt. 1998. Gorongosa National Park and Muaredzi Community Interrelationship. Unpublished report, Brunel University, London, UK.
Costanza, R., R. d’Arge, R. de Groot, S. Farberk, M. Grasso, B. Hannon, K. Limburg, S. Naeem, R. V. O’Neill, J. Paruelo, R. G. Raskin, P. Sutton, and M. van den Belt. 1997. The value of the world’s ecosystem services and natural capital. Nature 387:253–260.
Cumming, D. H. M., and T. J. P. Lynam. 1997. Landuse changes, wildlife conservation
and utilisation, and the sustainability of agro-ecosystems in the Zambezi Valley, Zimbabwe. WWF Zimbabwe, Final Technical Report to the European Union, Brussels, Belgium.
Farber, S. C., R. Costanza, and M. A. Wilson. 2002. Economic and ecological concepts for valuing ecosystem services. Ecological Economics 41:375–392.
Gauch, H. G., Jr. 1982. Multivariate analysis in community ecology. Cambridge University Press, Cambridge, UK.
Ludwig, J. A., and J. F. Reynolds. 1988. Statistical ecology: a primer on methods and computing. John Wiley, New York, New York, USA.
Lynam, T. J. P. 2001. Participatory systems analysis—an introductory guide. IES Special Report No. 22. Institute of Environmental Sciences (IES), University of Zimbabwe, Harare, Zimbabwe and Centre for International Forestry Research (CIFOR), Bogor, Indonesia.
Lynam, T. J. P. 1999. Adaptive analysis of locally complex systems in a globally complex world. Conservation Ecology 3(2):13. [online] URL: http://www.consecol.org/vol3/iss2/art13
Lynam, T. J. P., B. M. Campbell, and S. J. Vermeulen. 1994. Contingent valuation of multi-purpose tree resources in the smallholder farming sector, Zimbabwe. Working Paper Series 1994:8, Studies in Environmental Economics and Development, Department of Economics, Gothenburg University, Sweden.
Magurran, A. 1988. Ecological diversity and its measurement. Croom Helm, London, UK.
Mueller-Dombois, D., and H. Ellenberg. 1974. Aims and Methods of Vegetation Ecology. John Wiley, New York, New York, USA.
ter Braak, C. J. F. 1986. Canonical correspondence analysis: a new eigenvector technique for multivariate direct gradient analysis. Ecology 67:1167–1179.
ter Braak, C. J. F. 1988. CANOCO—an extension of DECORANA to analyse species–environment relationships. Vegetatio 75:159–160.
ter Braak, C. J. F. 1991. CANOCO—a Fortran program for canonical community ordination by [partial] [detrended] [canonical] correspondence analysis, principal components analysis and redundancy analysis. (Version 3.12.) Agricultural Mathematics Group, Technical Report, Wagenigen, The Netherlands.
ter Braak, C. J. F. 1995. Ordination. Pages 91–173 in R. G. H. Jongman, C.J.R. ter Braak, and O. F. R. van Tongeren, editors. Data analysis in community and landscape ecology.
Cambridge University Press, Cambridge, UK.
ter Braak, C. J. F., and P. Smilauer. 1997. CANOCO. Reference manual and user’s guide to CANOCO for Windows: software for canonical community ordinations. Version 4. Centre for Biometry, Wageningen, The Netherlands and Microcomputer Power, Ithaca, New York, USA.
Timberlake, J. R., N. Nobanda, and I. Mapaure. 1993. Vegetation survey of the communal lands—north and west Zimbabwe. Kirkia 14:171–270.
Tinley, K. L. 1977. Framework of the Gorongosa ecosystem. Dissertation, University
of Pretoria, Pretoria, South Africa.
van Tongeren, O. F. R. 1995. Cluster Analysis. Pages 174–212 in R. H. G. Jongman, C. J. F. ter Braak, and O. F. R. van Tongeren, O.F.R., editors. Data analysis in community and landscape ecology. Cambridge University Press, Cambridge, UK.
Wilson, M. A., and R. B. Howarth. 2002. Discourse-based valuation of ecosystem services: establishing fair outcomes through group deliberation. Ecological Economics 41:431–443.
Address of Correspondent:
Timothy Lynam
Institute of Environmental Studies, University of Zimbabwe,
P.O. Box MP167,
Mount Pleasant,
Harare, Zimbabwe
Phone: (263-4) 302603
Fax: (263-4) 302603
tlynam@science.uz.ac.zw

|