|
|
|
Copyright © 2003 by the author(s). Published here under license by The Resilience Alliance.
Go to the pdf version of this article.
The following is the established format for referencing this article:
Burnett, C., A. Fall, E. Tomppo, and R. Kalliola. 2003. Monitoring current status of and trends in boreal forest land use in Russian Karelia. Conservation Ecology 7(2): 8. [online] URL: http://www.consecol.org/vol7/iss2/art8/
Report Monitoring Current Status of and Trends in Boreal Forest Land Use in Russian Karelia Charles Burnett1, Andrew Fall2, Erkki Tomppo3, and Risto Kalliola4
1University of Salzburg; 2Simon Fraser University; 3Finnish Forest Research Institute; 4University of Turku
- Abstract
- Introduction
- Study Area
- Methods
- Results
- Discussion
- Responses to this Article
- Acknowledgments
- Literature Cited
Some of the last remaining near-natural boreal forest landscapes in northern Europe can be found in the Russian Karelia near its border with Finland. Currently, these forests are facing strong exploitation pressure in the form of extensive clearcuts. Demand for conservation is also high. We characterize the boreal forest landscape in the region and assess the impacts of past and potential management actions through a mapping and modeling study that synthesizes methods from landscape ecology, remote sensing, and simulation modeling. The forests of the study area were mapped using techniques for interpreting multitemporal satellite images and detecting changes. The species composition and structure of the forests were estimated using the multisource k-nearest neighbors (k-nn) method. Forest harvesting rates and current landscape patterns were used to parameterize models built with a cell-based Spatially Explicit Landscape Event Simulator (SELES) modeling tool, and alternative land-use policy strategies were simulated with and without natural fire. Based on 10 Monte Carlo runs for each scenario, we can predict dramatic changes in the forest landscape structure after 30–70 yr. The current, complexly structured, near-natural forest assemblage will rapidly be converted into its transpose: an expanse of young regeneration stands, with blocks of near-natural forest extant only as islands within mires and in the reserve areas. The prompt establishment of the proposed Kalevala National Park is regionally important for these reasons: (1) to increase the types of near-natural forest conserved, (2) to provide a second large biodiversity source adjacent to the heavily fragmented Finnish forests, and (3) to reduce the currently inflated rate of harvesting.
KEY WORDS: Karelia, Russia, Finland, boreal forest, conservation policy, dynamic modeling, fragmentation, land use, GIS.
Published: September 16, 2003
Evidence of the ecological significance and fragility of near-natural boreal forest ecosystems is growing, and northern forest managers are facing strong pressure to adopt management practices whose purpose is to preserve natural forest processes and species (Turner et al. 1995, Kurki 1997, Lindén et al. 2000). Managed boreal forests tend to differ markedly in structure at the landscape level compared with boreal landscapes that have been less modified by humans (Hansson 1992, Syrjänen et al. 1994). Currently, the ecological consequences for the landscape of forest management for intensive fiber extraction are not fully understood. Ecological investigations of small areas have been conducted to explore species-level responses to this phenomenon (Hanski and Haila 1987, Niemelä et al. 1992, Haila et al. 1994, Seppälä and Jouttijärvi 1997). Research on natural disturbance factors, both small-scale disturbances that induce gap formation (Kuuluvainen 1994, Kuuluvainen et al. 1998) and large-scale factors such as fire (Parviainen 1996, Ryan 2002), has also been initiated, but broader-scale questions have only begun to be addressed in the same context (Lindén et al. 2000). Early examples of this trend include the simulation of natural disturbance factors and processes in forestry by Bergeron et al. (2002) and Kuuluvainen (2002). Historical biological archives have also been explored as a natural reference to guide the development of nature-based silviculture models (Bradshaw et al. 1994).
The sustainable management of natural resources requires knowledge about ecosystems at multiple temporal and spatial scales (Bradshaw and Fortin 2000). The effects of anthropogenic partitioning of the boreal forest landscape at broad scales may involve complex interactions among biodiversity, ecosystem processes, and landscape dynamics (Turner et al. 1995). In particular, the consequences of patchiness for ecosystem functions became a major focus of research in the late 20th century (see Harris 1984, Hansson 1992, Wiens et al. 1993, Noss et al. 1997). Once the proportion of old-growth forests has diminished by more than a third, many forest species are predicted to decline (Andrén 1999, Aberg et al. 2000), and local extinction debt may accumulate (Moilanen and Hanski 1998, Hanski 1999, Hanski and Ovaskainen 2000).
In this context, natural landscapes are essential reference areas for fine-tuning our understanding of forest landscape ecology, management, and planning. Extensive near-natural boreal forest areas are scarce in Europe (Mykrä and Kurki 1998), and the remaining areas are seriously threatened by fragmentation as a result of clearcut harvesting. Some of the most important remnants are in northern Russia (Syrjänen et al. 1994, Yaroshenko et al. 2001). However, information about their structure and dynamics on the levels of both the stand and the landscape is incomplete. Here we explore the usefulness of an integrative research approach for producing meaningful forecasts and visualizations about the possible changes that could result from alternative forest-use strategies in an important old-forest area in Russian Karelia. The area of focus in this study suffers from a scarcity of quantitative stand-level field data, but the rapidity of deforestation does not allow for the generation of such data within the timeframe available for action. Our case situation thus exemplifies a very common problem in conservation ecology: a lack of data at the local scale. Researchers need to develop robust methodologies using the data available ... or remain silent. We show in this paper that, even under these circumstances, satellite image analysis supported by modest field-survey activities permits accurate mapping of the current forest at the landscape scale, and that these base data can be leveraged to effectively project landscape-level ecological trends for a region using spatially explicit simulation models.
Many scientists have called for research in the Russian taiga, where extensive and relatively unmodified forest areas still exist (Syrjänen et al. 1994, Uuttera et al. 1996, Lindén et al. 2000, Yaroshenko et al. 2001). The study area is one of several large forest remnants in Fennoscandia along the Finnish border in Russian Karelia. These areas are geopolitical artifacts: a military buffer mandated by Soviet policy. Given that there are clear-cut areas and young plantations just across the border in Finland, this situation can be seen as a unique ecological experiment awaiting examination; see Kalliola et al. (2002) for a more detailed description of the study area.
The study area covers forest areas north and west of the city of Kostamuksha (population 31,000) and extends westward to the Finnish/Russian border up to approximately 60 km northeast of the city of Kuhmo, Finland, and 17 km east of the border (Fig. 1). The study area, hereafter referred to as Vienansalo, encompasses approximately 280,000 ha of forest and mire and is centered on a point located 64° 41' N and 30° 4' E. The Vienansalo area lies north of the Kostamuksha Strict Nature Reserve and extends westward to the Finnish/Russian border.
In terms of climate, Vienansalo belongs to the middle boreal zone, whose geology is characterized by prequaternary bedrock covered by gravel and sandy ground moraine, glaciofluvial sands, or peat (Geographical Society of Finland 1990). The relief is gentle, with the highest elevations reaching 300 m above sea level. Apart from scattered lakes and small mires (Fig. 2), extensive coniferous and mixed forests prevail (Fig. 3). As described by Kalliola et al. (2001), the main tree species are Scotch pine (Pinus sylvestris), Norwegian spruce (Picea abies), birches (Betula pubescens, B. pendula), and quaking aspen (Populus tremula). Kuuluvainen et al. (2002) show that the pine-dominated old-growth forests in the Vienansalo wilderness region are characterized by trees with an uneven age distribution resulting mainly from natural disturbances, particularly fire.
The human impact in the Vienansalo region can be generalized to three types of activities: forest use, agriculture, and mining. The town of Kostamuksha was established in the 1970s to support the exploitation of the region's large deposits of iron ore. During subsequent decades, large areas have been transformed into a landscape of open mire, hills of waste stones, and dammed lakes (Fig. 2B). Small-scale agriculture and forestry have traditionally been practiced along rivers and beside the lakes in the region (Fig. 4). Industrial uses in the 20th century included tar extraction from pines and, since the 1980s, clear-cut harvesting (Fig. 5).
For political and geographic reasons, a few border areas have escaped clear-cut harvesting and constitute a large matrix of near-natural coniferous and mixed forests. These areas have been associated with several implemented and proposed conservation plans. The Nature Reserve Friendship (see Lindholm et al. 1997) is a Finnish-Russian network of protected areas near the Vienansalo region; the most important single component of this system on the Russian side is the Kostamuksha Strict Nature Reserve or Kostamuka zapovednik, which encompasses 47,569 ha. Vienansalo itself is being considered for inclusion within the proposed Kalevala Nature Park and, thanks to public pressure, the core Vienansalo area has since 1996 been temporarily removed from official forest management plans, and forestry companies are not permitted to operate within this moratorium area. Nature conservation in the region has also been discussed in broader conservation plans, particularly in a proposed "Green Belt" that would link patches of near-natural forests along the Finnish-Russian border. To make things even more complicated, there are conflicts related to the control of land and resource ownership between the relatively poor Republic of Karelia and Moscow that hinder management of this area (Piipponen 1999).
Land cover maps derived from satellite imagery have outstanding potential for assessing forest fragmentation and its impacts on greenhouse gas emissions, biodiversity, economics, and water quality (Riitters et al. 2000). Our integrative research takes land cover mapping a step further, with two consecutive components. The first component consists of a remote sensing survey supplemented by field work, the construction of a Geographic Information System (GIS), and a k-nearest neighbor (k-nn) parameter estimation used to assess the current status of the region's forests. The second component includes spatiotemporal modeling and analysis, which are used to explore potential future scenarios and their effects on indicators of landscape ecology (Fig. 6).
GIS database building, k-nn estimation, forest classification
The GIS database developed for this study comprised a multidate earth-observation (EO) image set, thematic maps, and field data compiled from four visits undertaken between 1997 and 1999. For practical reasons and to reflect the ways in which the forests are used, we divided the study region into four landscape zones (Fig. 7): the Regular Management Zone (RMZ), the Kostamuksha Strict Nature Reserve (KR), the Security Zone (SZ), and the Proposed Kalevala National Park (PP). Six sets of remote sensing data were used in this case study (Table 1) and processed in the University of Turku Laboratory of Computer Cartography using standard image processing (Erdas Imagine, ERMapper) and GIS (ArcView) software. The two SPOT XS images were used to create a mosaic based on ground control points (GCPs) collected from electronic maps (Perus-CD of the National Land Survey of Finland) and road intersection locations recorded with GPS in the field. All the Landsat Thematic Mapper (TM) images were registered to the SPOT base image. Root mean square (RMS) errors for the rectification of the image set were in the range of 1 pixel.
Changes in the forest state were detected through "false date" compositing interpretation. With this technique, channels of TM images from different dates of imagery were visualized in an RGB (red, green, blue) combination. Recently harvested cutblocks reflected relatively brightly in the near-infrared wavelengths. Thus, by combining TM band 5 of a later date on the red channel with TM bands 2 and 3 of an earlier date of imagery on blue and green, recent harvesting was highlighted as areas of a bright pink hue. Using these composite images, forest clearcuts were digitized on screen on the basis of rules describing harvest cutblock spectral signals, a minimum size, and a quadrilateral pattern. The resulting analysis was recorded in three GIS vector layers: pre-1988, 1988–1994, and 1994–1998 (Fig. 7).
Vector lines and polygons were mapped for roads, gravel pits, urban areas, and industrial areas through visual interpretation of the 1994 TM image. A mask for lakes and rivers was created by automatically deriving vectors from a thresholded TM IR:visible band ratio image. The extent of the KR was digitized from boundaries found on the regional 1:50,000 topographic map. The boundaries of the PP were supplied in digital form by the Forest Research Institute of the Russian Academy of Science in Petrozavodsk.
Two hundred and ten plots were assayed in the field (1997–2000), and the dominant vegetative species and structure parameters were recorded for each plot of forest. Field plots were chosen after first stratifying the study by means of unsupervised classification of the 1994 TM image. During field visits, significant efforts were made to explore each "type" of forest identified via this stratification in the region with the help of enhanced satellite images and unsupervised classification images. In this way, most forest types were assayed, although the pattern of field plot location seems decidedly road-biased (Fig. 8).
During each visit, large-scale prints of satellite images were taken into the field to record field plot locations. On the last visit, in September 1999, a GPS unit was slaved to a portable computer running GIS software and containing the SPOT-based spatial reference maps. The portable computer contained a complete copy of the field plot database and helped researchers identify areas that had not been examined to date. Two types of field survey methodologies were used. In type-A plots, a verbal description of the forest layers, species composition, and forest site type was provided in addition to four relascope surveys, which recorded the basal area (BA) of trees of different species, including dead standing individuals. In addition, the height of a typical canopy-forming tree was surveyed in each relascope survey plot. In type-B plots, a visual description and forest classification according to dominant species was noted.
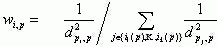
Using the field data and the 1994 Landsat TM image, variables were estimated at the Finnish Forest Research Institute using a nonparametric k-nn formula (Tomppo 1991) that made it possible to estimate all forest inventory variables at the same time (Tomppo et al. 1999, Franco-Lopez et al. 2001, Tomppo et al. 2001). The method uses a distance measure, d, that is defined in the feature space of the satellite image data. The feature space is composed of the spectral values recorded in the six TM channels (1–5 and 7) plus 12 derived channels (3 x 3 window local mean and standard deviation of each original channel). The k that are the closest to field plot pixels (in terms of d), i.e., the pixels that cover the center of a field plot,
 , , | (1) |
are sought for each pixel p under the forestry land mask of the cloud-free satellite image area. The corresponding field plots are denoted by
 . . | (2) |
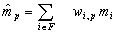
The weight wi,p of field plot i to pixel p is defined as:
 | (3) |
if and only if
 | (4) |
The squared distance is used to obtain more weight for the nearest field plots. A pixel-level estimate of the variable M for pixel p is defined as
 | (5) |
where mi is the value of the variable M on plot i.
A subset of 142 training sites was selected for input into the k-nn estimation program, and a value of 5 was used for k. The results were assessed via a pixel-level goodness of the estimates as per Halme and Tomppo (2001). A leave-one-out cross-validation method was applied (Efron and Tibshirani 1993).
We then stratified the forest areas into general classes based on the k-nn results. To convert from k-nn estimates to forest classes, we only used k-nn output layers 1 –3 and 5, respectively, percent pine, percent spruce, percent deciduous, and basal area live. In the final classification, cells were classified as water; nonforest, which included urban, gravel, and roads; or a forest class based on k-nn. As a first subdivision, we set aside the areas that had previously been harvested using the digitized GIS layers. We then assumed any of the remaining areas with a basal area of less than 11.1 m2/ ha to be either mire area or an area of nonmerchantable timber. Within the nonharvested forest areas, we selected the lead and secondary species based on the largest and second-largest percentages of k-nn estimates 1–3. If the second-largest proportion was less than 25% of the sum of the two, then we assumed that the cell was a "pure" stand and designated it as either pine, spruce, or deciduous. Otherwise, we designated cells as pine-spruce, pine-deciduous, spruce-pine, spruce-deciduous, deciduous-pine, or deciduous-spruce.
Dynamic model assemblyThe dynamics of forest structure were assessed using the Spatially Explicit Landscape Event Simulator (SELES). This modeling environment was chosen because it supports the development of grid-based discrete-event models of landscape dynamics and allows for the independent design and implementation of submodels of landscape processes that interact via changes to the state of the landscape as the simulations run (Carpendale et al. 1999, Fall and Fall 2001, Fall et al. 2001).
We developed submodels for forest succession, timber harvesting and fire, and simulated scenarios based on plausible future management directions derived from the time series of remote data. The spatial state space consisted of raster grids with a common resolution of 60 m or 0.36 ha cells and an extent of slightly more than 680,000 defined cells on a grid of slightly more than 1.2 x 10⁶ cells. The model scale of the pixels was coarsened to 60 m from the Landsat TM input resolution of 30 m so that each SELES scenario simulation could be completed on a workstation with a dual 800 MHz Pentium III with 512 MB of RAM within 12 hr. Upscaling was justified because the forest classification used in the modeling is, hierarchically, a level above the k-nn estimation. Additionally, the fire and harvesting processes were actualized in the model at an order of magnitude coarser than the 60 m resolution, i.e., the number of pixels per fire and cutblock is > 10, or > 600 m2. Static spatial information included topography, i.e., elevation, slope, and aspect; previous harvest history derived from the GIS database in terms of pre-1988, 1988–1994, and 1994–1998 clearcuts; and the distinguished landscape zones, including reserve and proposed park locations and security zone areas. Dynamic information included the main forest types, such as nonforest, pine, spruce, deciduous, pine-spruce, pine-deciduous, spruce-pine, spruce-deciduous, deciduous-pine, and deciduous-spruce; stand age; distance to nearest road location; time since fire; and time since logging. Stand age was estimated based on the k-nn estimates and the three clearcut vector layers. Further details on the three submodels are provided below.
The timber harvest model was parameterized based on the rate of harvesting determined from the satellite-based change analysis. Pure deciduous stands were not eligible for harvest because in this area they are predominantly young and slow-growing, which tends to exempt them from logging pressure. Harvesting was processed annually with a specified area-based target. Minimum harvest age was set at 80 yr. Each year, the model attempted to meet the annual harvest target by placing clearcuts in eligible cells with a preference for older stands and stands closer to roads. We assumed that clearcuts could be placed at a maximum of 1 km from a road, which was parameterized based on analysis of a 1998 TM image. The size of each block was based on the observed post-1994 clearcuts and selected from a normal distribution with a mean of 51 ha and a standard deviation of 40 ha. Because treatments were assumed to be clearcuts, stand age was reset to zero in logged cells. After initiating a block, the model spread to adjacent cells until no more eligible adjacent cells existed or until the selected block size had been reached. After a block was completed, the distance-to-road layer was updated. We assumed that a road was built to each clearcut, for which reason new blocks had a distance of zero to the nearest road and possibly opened access to stands beyond.
The fire model attempted to provide a robust view of the kind of forest landscape that could result from frequent yet stochastically distributed forest fires. As reviewed by Ryan (2002), forest structure and fire behaviour constitute a highly dynamic interaction in which fire type, frequency, extent, seasonality, magnitude, and synergy provide the major attributes. Because of these complex interactions, tree age distributions in old-growth forests vary considerably, as documented by several studies in Fennoscandia (e.g. Haapanen and Siitonen 1979, Kuuluvainen et al. 2002, Wallenius et al. 2002). Whereas Pennanen (2002) has simulated the stand-level consequences of alternative fire models in the region, our approach is complementary in that it explores the kind of landscape structure, at the broad scale, that could result from moderately frequent burnings. Our goal was to introduce a simple, empirical model of disturbance to gain insight into the variability of the old forest in unmanaged stands and to explore how fire and harvesting interacted. We implemented an interval of 250 yr for stand-replacing fires as a reasonable estimate to obtain an insight into the type of landscape structure that could prevail in the region in contrast to human-dominated clear-cut blocks and regeneration stands. Because the model was knowingly ignorant of the variability of many crucial fire attributes, the results should be considered illustrative of a possible fire-characterized landscape structure rather than a genuine projection that aims to reflect the consequences of fire dominance at the stand level.
We implemented an empirical fire model similar to the one described in Li et al. (1997), in which the mean percent burned per year is an input parameter; we conservatively set this value at 0.4% for a mean fire return interval of 250 yr. The model selected the amount to burn in a given year from a negative exponential distribution, because the modeled fires burned independent of age, a common simplifying assumption for studies in boreal forests (Van Wagner 1978, Boychuk and Perera 1997) that we used because we did not track climatic changes. We did not have information on how the amount of annual area burned was distributed between fire size and number of fires. We divided the annual area to burn among a stochastic number of fire openings, normally distributed with a mean of 15 and standard deviation of 5. This choice influenced only the patch metrics for the scenarios that included fire. The area burned in each fire year was divided randomly among individual fires. Fires spread from a burnt cell to a random number of adjacent cells (at least one) to produce variable-shaped patches with unburned remnants, and continued until the selected fire size was reached. The primary effect of fire was to reset stand age and to set the time since the previous fire layer. Thus, fires were assumed to be stand-replacing, a simplification that is criticized in the discussion. Time-since-disturbance maps were used to track disturbance history in the model. As the fire and harvesting models progressed, the spatial locations of disturbances became visible in these layers as well as in other dynamic layers.
The succession model captured stand aging and species shifts with a simple semi-Markov chain model. The only relevant effect of species in terms of the indicators presented was that pure deciduous stands were unavailable for harvesting; consequently, the effect of modeling succession was only to delay the harvesting of certain stands. Furthermore, at the start of the simulation, less than 1% of the forest was purely deciduous. Hence, the effect of succession on the model results was negligible, and detailed discussion of this submodel is not warranted.
We defined verification as an assurance that the model was implemented as specified, and validation as an assurance of the appropriateness of the model for its intended use (Rykiel 1996). The SELES modeling language creates transparent models that facilitate verification. We undertook a range of experimental tests and sensitivity analyses to ensure that the implemented model matched the conceptual model described, although these data are not shown. Validation is often assessed as the degree to which model output matches an independent data set (Rykiel 1996). Although very useful, such empirical or data validation for a spatiotemporal model is only possible in cases with short time lags in system response or for which suitable replicates exist, e.g. for chronosequence-type comparisons. Neither of these cases holds for situations involving regional-scale systems and long time horizons such as in the model we present. The exact conditions encountered within this system cannot be found outside the system (Levin 1992), and future states of the system will be comparable only with the actual management direction taken for the region, by which time many options may be foreclosed. In the present study, it is more appropriate to rely on conceptual and logical validation (Rykiel 1996), in which one views the model as a hypothesis and model output as a consequence of the hypothesis. That is, the purpose of the model is to assist planning by establishing a clear link between the initial conditions, parameter values, and process behavior, and the consequences of those assumptions, which are projected via simulation. Our approach to validation has been the extensive use of sensitivity analysis to ensure that this link between cause and effect can be clearly explained. Thus, logical validation relies on the adequacy of the input information regarding initial conditions, model processes, and appropriate parameter values. Refinement of these can occur over time as ecological knowledge is refined as part of adaptive management.
We ran five different scenarios (Fig. 9): Status Quo, Fiber Maximum, Conservation, Fire Only, and Status Quo plus Fire. The three management regimes were based on three potential pathways that future management may follow, and these differed in terms of harvest rate and the area available for harvest. These regimes represented key management policy decisions that ought to be made for the region regarding conservation and development. We kept the main parameters for these regimes simple so that they could be derived from historical remote sensing data and current administrative boundaries. Harvesting in the Kostamuksha Reserve (KR) was prohibited in all scenarios.
Because each model run provided only one sample from the distribution of possible future conditions that could result from the dynamics specified by the models, Monte Carlo runs were used to assess the various scenarios. An assessment was made of the variation in results between runs after 10 Monte Carlo runs had been completed. The coefficients of variation (CVs) for change in area of old forest were at most 0.1 and 2.8% for the scenarios without and with fire, respectively. The CVs for the main pattern metrics was at most 4.9 and 10.1% for the scenarios without and with fire, respectively. The only exception was for the minimum spanning tree weight, which had a CV of up to 85.3%. Because the variation was considered sufficiently low, we focused on temporal trends based on mean values from all the runs for the analysis.
The Status Quo scenario was designed to examine the structure of the forests in the area if the management situation in place in 1998 and as of December 2001 were to continue. In this case, the PP would not be legally recognized. Two conditions are significant: (1) a moratorium on harvesting in the proposed parklands that is supported by the forest industry is still being observed even though the area has not been legally designated as a park, and (2) the PP area is kept in the accounting when determining how much area of forest is harvested each year. We estimated a base harvest rate by dividing the mean annual area cut between 1994 and 1998 by the area available, which was approximately 1% of the forest per year for a rotation of approximately 100 yr, which roughly agrees with Finnish forestry recommendations at this latitude. For the Status Quo scenario, the base rate of the potentially available harvest area, i.e., all forest RMZ plus the PP, resulted in an annual target of 3250 ha. Notably, the harvest rate of 1% of the RMZ plus the PP areas is more than 1% of the area actually available for harvesting.
The Fiber Maximum scenario was designed to capture trends in the event that the area was managed for a maximum supply of timber in the short to medium term. In this scenario, the plan to create the PP was assumed to have been abandoned, so that harvesting in the PP and the SZ, in addition to forests in the RMZ, was not only allowed but permitted to occur at twice the observed rate, i.e., 2%/yr. We also ran this scenario using a higher harvest rate of 3% of the available forest area. The Conservation scenario was designed to examine the forest structure that might exist if plans for the PP were ratified and the park area was removed from the accounting of forest area harvested per year. Thus, the difference from the Status Quo scenario is a decrease in the yearly area cut.
The Fire Only scenario was an experiment that included only the fire model with no harvesting. By this we hoped to make informed speculations on the role that natural fires play in shaping landscape structure and provide further insight into the likely amount of old forest currently on the landscape. The Status Quo plus Fire scenario was used to examine the influences of fire disturbance combined with the logging and conservation trends and policies defined in the Status Quo scenario. The goal of this latter scenario was to illustrate how an ongoing fire regime may interact with management practices to have synergistic impacts on the amounts and patterns of old forest.
Model reporting and analysisWe used only two types of patches to assess changes in the configuration of the forest landscape and to emphasize old forest, which has a high conservation value in Fennoscandia. For our initial stratification of the landscape (see GIS database building, k-nn estimation, forest classification above), we defined "old forest" as any forest at least 150 yr in age, and other forests were designated "young forest." Because in our classification of the satellite imagery we do not attempt to map stand patches originating from wildfire, our estimate of the state of old forest is an overestimate. There must be areas within our old forest that are younger than 150 yr that we could not "map" from the EO images because of their irregular shape and spectral similarity to neighboring pixels. Because unmanaged stands regenerating after fire tend to have a high degree of structure relative to managed stands of the same time since disturbance, our old forest/young forest distinction can be viewed as the distinction between unmanaged, i.e., natural and seminatural, and managed forests. In the subsequent modeling phase (see Dynamic model assembly), we assumed that all fires were stand-replacing, and thus the binary old forest/young forest analysis was perpetuated. Fire and logging information included the annual and cumulative areas disturbed. In addition to summary information, the model outputs included layers for forest age, time since fire, and time since logging on a 10 yr interval showing the sequence of state changes over time.
We calculated the following key landscape metrics on the model: number of patches, mean patch size, and size of the largest patch instances (Marks and McGarigal 1995). We also calculated the minimum spanning tree (MST), the set of shortest links between patch perimeters that connected all the patches of a given type in the landscape (Urban and Keitt 2001). It should be noted that, if there are n patches, then there are n-1 links in the MST, because, if there is a cycle, then there must be at least one superfluous link. Although it is easy to show that the set of nearest-neighbor links forms part of the MST, other links are required to connect all the patches. In addition, the MST has no cycles, i.e., sequences of links from a patch back to itself without repeating a link; otherwise at least one link would be redundant. The MST is useful for characterizing the underlying backbone of connectivity between the patches across a landscape (Urban and Keitt 2001). The mean link distances and the summed total of all link distances in the MST are both useful measures for exploring certain aspects of fragmentation. To keep simulation computer times reasonable, we performed the statistical analyses at 5-yr intervals during the simulation.
It is important to note that the patch concept is defined in this study as any number of contiguous cells whose connections include diagonals. A patch of young forest consists of any contiguous cells of forest less than 150 yr in age, regardless of whether this patch originated from several different clear-cut or fire events.
Our multitemporal GIS database (Fig. 7) records a major change in forest harvesting practices between the years 1988 and 1998. Prior to 1988, large clearcuts had advanced westward in the eastern part of the study area, resulting in a belt of clear-cut landscape that left the western part and the border zone near Finland relatively intact. During 1988–1994, although most of the new clearcuts were made north of the mine/mine lake complex or next to the pre-1988 clearcuts, some new clearcuts had begun north of the city. The 1994–1998 era also revealed a new type of forest cutting policy that resulted in a unique landscape of quadrangular chessboard clearcuts (Fig. 10) embedded in a near-natural forest matrix.
Estimations of k-nn for forest variables
The k-nn estimations for forest species and structure are mapped in Fig. 11. Note that these estimations were also conducted on clear-cut areas, and the height and basal area maps (Figs. 11D and 11E) correctly show low height and basal areas in the Soviet-era clear-cut sectors in the east. Note also that the deciduous trees occur naturally only in integrated mixed assemblages; pure stands result only from human disturbance. Thus we see a uniform estimate of deciduous stands throughout the region (Fig. 11C), but with higher concentrations near villages.
The stepwise cross-validation conducted on these k-nn estimates is shown in Table 1. This "leave-one-out" testing shows good results for the estimation. For instance, for a k value of 5, the root mean square error (RMSE) is lower than is normally considered acceptable for the Finnish National Forest Inventory calculations.
Forest landscape changes according to different scenariosUnder the Status Quo scenario, old forests (> 150 yr old) will disappear completely from the regular management zone within a period of less than 80 yr, and the assumed protected areas will remain as separated blocks of old forest in the KR, PP, and SZ (Fig. 12A). The Status Quo simulation suggests that new forest clearcuts will advance across the entire RMZ in a roughly southwest direction, finally leaving the conservation areas as large, sharp-edged patches embedded in a matrix of young forest.
Figure 12B shows the pattern dynamics that will occur in the accelerated Fiber Maximum scenario: conversion to almost total young forest patches happens at the halfway mark of the simulation, after approximately 50 yr. Note that harvesting also occurs in the PP zone. In Fig. 12C we observe that the reduced rate of cut and the exclusion of the two reserve areas has the effect of preserving large contiguous areas of old forest, while leaving a network of such areas within the RMZ. Unfortunately, as we can see from later graphs that show the simulations extended an extra 150 yr beyond the 100 yr terminus of the animations, these networks are not sustainable at even this lowered rate of cut.
The Fire Only scenario (Fig. 12D) draws attention to the very clear differences between human-induced systematic and fire-induced "natural" disturbances. The former lead to effective fragmentation of old forest patches within the RMZ, and the latter to an archipelago of young forest patches. The most "realistic" of our coarse scenarios, Status Quo plus Fire, is presented in the 100-yr Fig. 12E animation.
The time horizon when all the old forest in the RMZ will have been exhausted is year 2044 for the Fiber Maximum scenario, 2066 for the Status Quo scenario, but not until 2140 for the Conservation scenario (Fig. 13). In the Conservation scenario, the trend in old forest removal mirrors that of the Status Quo until 2066, and then drops markedly. This is a result of the lower rate of harvest, which allows second-growth forest to age beyond the minimum harvest age of 80 yr; some of this second-growth forest is likely to be more accessible than the remaining fragments of old forest. In all scenarios, gradual increases in the amount of old forest area in the RMZ after 140 yr occur because of the maturation of the reforested Soviet-era clear-cut areas. However, this increase in old forest is not sustained because the harvest rotation is shorter than 150 yr.
Because of the simple binary classification system ("old" or "young" forest), if the simulation places a new clear-cut next to an area of forest younger than 150 yr, the number of young forest patches (Fig. 14) will not increase, whereas the number of old forest patches may either increase if the harvesting divides an old patch into two or decrease if the young patch eliminates one or more of the old patches. This is why the number of patches increases only modestly for young forest, but first increases and then drops quickly for the areas of old forest. Comparing the scenarios, although the main difference between Status Quo and Fiber Maximum is the speed of changes, their overall consequences as far as contiguous patches are concerned are rather similar. Both scenarios suggest a dramatic increase in the number of old forest fragments, each of which decreases in size. The largest contiguous patch will be a clearcut/regeneration stand complex after 35 yr in the Status Quo scenario and in less than 20 yr in Fiber Maximum scenario (Fig. 15). The increase in mean patch size of old forest in the Fiber Maximum scenario after 45 yr is because of the final loss of tiny forest fragments, leaving only the large old-forest patches in the Kostamuksha reserve.
The percent of old forest overall and in the RMZ under the various management scenarios at 10, 50, and 100 yr are summarized in Table 2. The Status Quo and Conservation scenarios differ only in their harvest rate, not the area available for harvest, which is restricted to the RMZ. Thus, the difference in overall old-forest coverage is minor. However, the rate of loss of old forest in the RMZ differs significantly between these scenarios. The Fiber Maximum scenario increases the rate of harvest compared to the Status Quo and opens the SZ and PP areas to logging. This is reflected in the table, which shows both a more rapid decrease in the amount of old forest and a lower final overall percentage of old forest. Apart from remnant seed-tree patches, current harvesting rates will remove all the old forest outside of protected areas in less than 100 yr.
Figures 16A, 16B, and 16C present the results of the minimum spanning tree analysis and show trends in connectivity. Isolation of fragments occurs through the fragmentation of old forest, resulting in an almost exponential increase in the mean spanning tree distance (Fig. 17). Because harvesting is conducted only in the regular management zone, the computed scenarios of Status Quo and Conservation show almost identical consequences. However, the lower harvesting rates in Conservation result in a less dramatic increase in patch isolation.
In this paper we have integrated change analysis based on medium-resolution satellite imagery, a nonparametric estimation of forest parameters, and dynamic cell-based scenario modeling to support conservation planning in an area for which reliable field data are limited. The product is a multifaceted set of spatial information that includes (1) the spatial and temporal extents of landscape features, e.g., clearcuts and protected areas, in vector format; (2) forest tree species, height, and basal area estimates in raster format; and (3) raster layers of potential forest fragmentation level and distribution produced by spatiotemporal modeling. The database thus extends backward and forward temporally and spatially over a regional area.
We suggest that there is a growing demand for this type of synthetic approach to assessing forest fragmentation at the landscape level. Through multitemporal monitoring, the modeling of past and present patterns can be explored and prognoses made for the future (Baker 1989, Pennanen 2002). The methodology is especially appealing because the satellite imagery required is relatively inexpensive, and some of the tools, e.g., the Spatially Explicit Landscape Event Simulator, are free.
The forest classification derived from multitemporal satellite imagery proved its usefulness as a base layer for input into a dynamic landscape model. The proposed park area is characterized by pine-dominated forests, both along dry esker ridges (Fig. 11A) and in mires (see the low basal area at the border of the Proposed Kalevala National Park in Fig. 11E). In contrast, the strict nature reserve and lands directly to the east contain forests with a larger proportion of spruce (Fig. 11B). The low basal area in the zone that divides the reserve and the proposed park (Fig. 11E) should also be noted; this is evidence of a large number of open mires. Thus, according to the k-nearest neighbor mapping, the proposed park would conserve quite a different forest landscape than the one in the existing reserve, and the two are separated by a heavily trafficked road and a mire rich landscape. The spatial distribution of basal area in standing dead trees is also illustrative. Figure 11F demonstrates that coarse woody debris is ubiquitous in all of the old forest areas except the mire region. However, standing dead material has been eradicated from the Soviet-era clear-cut areas in the east (Kalliola et al. 2001).
Maps of the decreasing old-forest areas and their presentation as a time-snapshot movie (Fig. 12) express the outcome of the model in such a way that it can also be easily criticized by nonexperts. This property of cartographic communication allows a variety of stakeholders to be involved in decision making, even for science-related questions that may be difficult to communicate by other means (Mäki and Kalliola 2001). The models also permit easy adjustment of assumptions and the evaluation of their consequences at the landscape level. To assess the sensitivity of our scenarios to changes in the submodels, we also ran a management scenario with an even higher rate of harvesting, 3% instead of 2%. Figure 18 demonstrates that, if harvest levels are allowed to increase and logging is permitted in the proposed park and security zone at this increased level, we can predict that nonprotected old forest in the region outside the Kostamuksha Strict Nature Reserve will disappear in 30 yr as opposed to 45. These scenarios are clearly sensitive to small changes in assumptions and parameterization, and emphasis should be placed on the trends revealed in the analysis rather than on explicit times for predicted changes to occur in the landscape.
Simulation results at the landscape level
Although the long-term consequences of the management scenarios for old forest could be derived analytically, the use of a simulation model is helpful when assessing temporal trends and spatial patterns of development. Examples of landscape-level grid-based modeling such as the one described here have been conducted on Amazonian colonization frontiers (Soares-Fihlo et al. 2002) and land use/land cover changes in the midwestern United States (Brown et al. 2000). All such experiments necessarily trade model resolution for model extent. By resolution we refer not only to the spatial and temporal scales at which the scenarios are implemented, but also to the number and sophistication of the submodels they incorporate. Future work in the Vienansalo framework could implement stand-level modeling such as the type used by Pennanen (2002). However, the more site-specific and detailed the modeling exercise is, the more accurate the input data need to be, a condition that cannot always be met in landscape-level research in remote areas.
Several trends in patch analysis are of interest for conservation planning ecology. Our results show that, within approximately 30 yr, the landscape studied will have more young forest than old forest areas, indicating a shift in the underlying landscape matrix. Mean patch size (Fig. 19) for young forest will not change monotonically during the process of fragmentation. Because there are large areas of Soviet-era clearcuts in the eastern section of the survey area, the dissection factor causes new, smaller clearcuts placed in the old forest matrix to temporarily depress the mean patch size in the young forest, which explains the early dip in mean patch size (Fig. 19). From these initial relatively small and isolated young forest patches, we expect mean patch size first to increase as the blocks begin to coalesce and then start to decrease at the threshold at which the last small, isolated old forest fragments in the regularly managed zone, e.g., tree islands surrounded by mire, start to disappear. This threshold marks a key phase transition in the shift from a landscape structure dominated by old forest to one dominated by young forest. In our Status Quo scenario, this transition occurs at about year 65. In the Conservation scenario, the transition occurs at about the same time, but the shift is less abrupt. The Fiber Maximum scenario results in a drastic reduction of this phase transition to year 35. Furthermore, the statistics related to contiguous patches in the Conservation scenario do not differ markedly from the Status Quo scenario, which is mainly an indication of the blocklike nature of the conservation of large landscape entities.
The connectivity of the patches in a landscape is another component of fragmentation (Trzcinski et al. 1999). In our experiments, the minimum spanning tree (MST) as seen in Fig. 16 is the set of interpatch links that connects all the patches in the landscape and that has the minimum overall length or sum of the link distances. Urban and Kiett (2001) propose that the MST of habitat patches is an important indicator of population connectivity. In our study, the MST represents the connectivity of old forest patches and, hence, the connectivity of habitat for species that are dependent on old forest. Because we are interested in time series under different scenarios, we developed an indicator that summarizes the MST. The sum of all link distances in the MST (tMST) will be higher for patch configurations that are more dispersed and contain more patches. As with mean patch size for young forest, this index will not increase monotonically during the process of fragmentation. We expect the tMST for old forest to increase as patches become dissected, i.e., more numerous, and more isolated, i.e., with longer links. Nevertheless, at a certain threshold, old forest patches will start to disappear, and the tMST will decline. Fig. 17 shows how the tMST of the old forest increases over the first 50 yr as the forest declines, which implies an increasingly disconnected old forest habitat. However, it takes more than 50 yr to reach the peak value.
Klenner et al. (2000) note that adding wildfire to management scenarios substantially reduces the amount of near-natural habitat in designated near-natural management area reserves, which compromises the ability of managers to maintain the areas of near-natural forest at target levels. Including fire in our scenarios demonstrates how this disturbance agent imposes another stress on the remaining old forest in the area (Table 3). The Fire Only scenario shows how even a relatively long fire cycle of 250 yr can result in a significant reduction in the amount of old forest. In reality, fire has historically been the dominant disturbance agent on the landscape and has created a range of age patches across the landscape. This would suggest that there is less old forest in the study area than we initially estimated. However, fire-disturbed patches are essential to the long-term health of the boreal ecosystem, and thus our old forest is meant as a catch-all to include a mixture of stands of different ages. Analyses such as these beg the question: what should the spatial characteristics of old forest patches be outside of restricted areas?
Conservation implications: the future of the Vienansalo forests
The future of some of the elementary components of the taiga in Fennoscandia depends on the condition of the taiga forests in Russia and on the connectivity of the Fennoscandian forest between Russia and Finland (Lindén et al. 2000). Given the patterns of harvesting we monitored and the scenarios modeled, we suggest that, in as little as 50 yr, near-natural forests in the study area will be found only in those areas that have been set aside for conservation.
Considering a longer time span, some of the previously harvested regeneration areas may possibly reach a mature enough stage to provide habitat for old-growth species. However, the rapidity and spatial pattern of this change from near-natural forest to clearcut may prohibit the effective migration of old-growth species to maturing sites. Consequently, the eventual species composition and tree population structure will probably be different from those of the near-natural forests being logged today (Kalliola et al. 2001).
From a conservation point of view, it seems desirable to ensure the connectivity between the different conservation areas described, for example, by our Conservation scenario, in which the harvest rate is lowered and the present Kostamuksha Strict Nature Reserve and the Proposed Kalevala National Park are linked through the border security zone (see Fig. 12C). Whether this scenario can be applied in the real world depends not only on the decisions and attitudes of Russian society but also on the involvement of stakeholders from northern Europe, including forestry companies, conservationists, the public, and politicians. To what extent can Vienansalo forests be managed as a biodiversity storehouse? In 50 yr, we may not have the luxury of asking this question.
Responses to this article are invited. If accepted for publication, your response will be hyperlinked to the article. To submit a comment, follow this link. To read comments already accepted, follow this link.
This research was conducted as part of the the Landscapes of the Past, Present and Future Project while the first author was a Ph.D. student at the University of Turku. Funding was provided by the Information Research Programme of the Academy of Finland (SA37121). Click here for access to the Landscapes Web page. Click here for information on the SELES modeling tools. We thank Dr. Raimo Heikkilä and Dr. A. Gromtsev for boundary data from the Kostamushka Nature Reserve and the Kalevala Proposed National Park. We also thank our research colleagues in the field, and Dr. Petri Pellikka and Mark Higgins for valuable comments.
Aberg, J., J. E. Swenson, and H. Andren. 2000. The dynamics of hazel grouse (Bonasa bonasia L.) occurence in habitat fragments. Canadian Journal of Zoology 78:352-358.
Andrén, H. 1999. Habitat fragmentation, the random sample hypothesis and critical thresholds. Oikos 2:306.
Baker, W. L. 1989. A review of models of landscape change. Landscape Ecology 2:111-133.
Bergeron, Y., A. Leduc, B. D. Harvey, and S. Gauthire. 2002. Natural fire regime: a guide for sustainable management of the Canadean boreal forest. Silva Fennica 36(1): 81-95.
Boychuk, D., and A. H. Perera. 1997. Modeling temporal variability of boreal landscape age-classes under different fire disturbance regimes. Canadian Journal of Forest Research 27: 1083-1094.
Bradshaw, R., P. Gemmel, and L. Bjorkman. 1994. Development of nature-based silvicultural models in southern Sweden: the scientific backgound. Forest and Landscape Research 1:95-110.
Bradshaw, G. A. and M.-J. Fortin. 2000. Landscape heterogeneity effects on scaling and monitoring large areas using remote sensing data. Geographic Information Sciences 6:61-68.
Brown, D. G., B. C. Pijanowski, and J. D. Duh. 2000. Modeling the relationships between land use and land cover on private lands in the Upper Midwest, USA. Journal of Environmental Management 59:247-263.
Carpendale S., A. Fall, D. Cowperthwaite, J. Fall, and F. D. Fracchia. 1999. Final report for the Simulating and Visualizing Forest Ecosystem Dynamics Project. Forest Renewal British Columbia, Science Council of British Columbia and Simon Fraser University, Burnaby, British Columbia, Canada.
Efron, B., and R. Tibshirani. 1993. An introduction to the bootstrap. Chapman and Hall, New York, New York, USA.
Fall, A., and J. Fall. 2001. A domain-specific language for models of landscape dynamics. Ecological modeling 141(1-3):1-18.
Fall, A., D. Daust, and D. Morgan. 2001. A framework and software tool to support collaborative landscape analysis: fitting square pegs into square holes. Transactions in GIS 5:67-86.
Franco-Lopez, H., A. R. Ek, and M. E. Bauer. 2001. Estimation and mapping of forest stand density, volume and cover type using the k-nearest neighbors method. Remote Sensing of Environment 77:251-274.
Geographical Society of Finland. 1987. Climate. Atlas of Finland, Number 131. Maanmittaushallitus, Helsinki, Finland.
Geographical Society of Finland. 1990. Geology. Atlas of Finland, Number 123-126. Maanmittaushallitus, Helsinki, Finland.
Haapanen, A., and P. Siitonen. 1978. Forest fires in Ulvinsalo District Nature Reserve. Silva Fennica 12:187-200.
Haila, Y., J. Kouki, J. Niemela, and P. Niemela. 1994. Metsatalouden ekologiset vaikutukset boreaalisessa havumetsassa: tutkimustuloksista kaytannon suosituksiin. Finnish Forest Research Institute, Research Paper Number 482. Ministry of Agriculture and Forestry, Helsinki, Finland.
Halme, M., and E. Tomppo. 2001. Improving the accuracy of multisource forest inventory estimates by reducing plot location error—a multicriteria approach. Remote Sensing of Environment 78:321-327.
Hanski, I. 1999. Habitat connectivity, habitat continuity, and metapopulations in dynamic landscapes. Oikos 87: 209.
Hanski, I. K., and Y. Haila. 1987. Singing territories and home ranges of breeding chaffinches: visual observation vs. radio-tracking. Ornis Fennica 65:97-103.
Hanski, I., and O. Ovaskainen. 2000. The metapopulation capacity of a fragmented landscape. Nature 404:755.
Hansson, L. 1992. Landscape ecology of boreal forests. Trends in Ecology and Evolution 7:299-302.
Harris, L. D. 1984. The fragmented forest: island biogeography theory and the preservation of biotic diversity. University of Chicago Press, Chicago, Illinois, USA.
Kalliola, R., C. Burnett, and I. Suojanen. 2003. Change in near-natural boreal forest landscapes: Viena Karelia in the central border region of Finland and Russia. Finnish Environment Institute, Helsinki, Finland, in press.
Klenner, W., W. Kurz, and S. Beukema. 2000. Habitat patterns in forested landscapes: management practices and the uncertainty associated with natural disturbances. Computers and Electronics in Agriculture 27:243-262.
Kurki, S. 1997. Spatial variation in the breeding success of forest grouse: the role of predation in fragmented boreal forest landscapes. Dissertation, University of Turku, Turku, Finland.
Kuuluvainen, T. 1994. Gap disturbance, ground microtopography, and the regeneration dynamics of boreal coniferous forests in Finland: a review. Annales Zoologici Fennici 31:35-51.
Kuuluvainen, T. 2002. Natural variability of forests as a reference for restoring and managing biological diversity in boreal Fennoscandia. Silva Fennica 36(1):97-125.
Kuuluvainen. T., E. Järvinen, T. J. Hokkanen, S. Rouvinen, and K. Heikkinen. 1998. Structural heterogeneity and spatial autocorrelation in a natural mature Pinus sylvestris dominated forest. Ecography 21(2):159-174.
Kuuluvainen, T., J. Mäki, L. Karjalainen, and H. Lehtonen. 2002. Tree age distributions in old-growth forest sites in Vienansalo wilderness, Eastern Fennoscandia. Silva Fennica 36(1):169-184.
Levin, S. A. 1992. The problem of pattern and scale in ecology: the Robert MacArthur Award Lecture. Ecology 73:1943-1967.
Li, C., M. Ter-Mikaelian, and A. Perera. 1997. Temporal fire disturbance patterns on a forest landscape. Ecological modeling 99:137-150.
Lindén, H., P. I. Danilov, A. N. Gromtshev, P. Helle, E. V. Ivanter, and J. Kurhinen. 2000. Large-scale forest corridors to connect the taiga fauna to Fennoscandia. Wildlife Biology 6(3):179-188.
Lindholm, T., R. Heikkilä, and M. Heikkilä, editors. 1997. Ecosystems, fauna and flora of the Finnish-Russian Nature Reserve Friendship. The Finnish Environment 124:1-364.
Mäki, S., and R. Kalliola. 2001. Cartographic visualization of scientific uncertainty in a printed map of the Amazon environment. Cartographica 37:27-42.
Marks, B. J., and K. McGarigal. 1995. FRAGSTATS: spatial pattern analysis program for quantifying landscape structure. U.S. Forest Service General Technical Report PNW-351.
Moilanen, A., and I. Hanski. 1998. Metapopulation dynamics: effects of habitat quality and landscape structure. Ecology 79:2503-2515.
Mykrä, S., and S. Kurki. 1998. ESC-strategy for rational operationalization of forest biodiversity maintenance in Finland. Silva Fennica 32(4): 389-399.
Niemelä, J., J. R. Spence, and D. H. Spence. 1992. Habitat associations and seasonal activity of ground-beetles (Coleoptera, Carabidae) in central Alberta. The Canadian Entomologist 124:521-540.
Noss, R. F., M. A. O'Connell, and D. D. Murphy. 1997. The science of conservation planning: habitat conservation under the Endangered Species Act. Island Press, Washington, D.C., USA.
Parviainen, J. 1996. Impact of fire on Finnish forest: past and today. Silva Fennica 30:353-359.
Pennanen, J. 2002. Forest age distribution under mixed-severity fire regimes—a simulation-based analysis for middle boreal Fennoscandia. Silva Fennica 36(1):213-231.
Piipponen, M. 1999. Transition in the forest sector of the Republic of Karelia, Finland. Fennia 177:185-233.
Riitters, K., J. Wickham, R. O'Neill, B. Jones, and E. Smith. 2000. Global-scale patterns of forest fragmentation. Conservation Ecology 4(2): 3. [online] URL: http://www.consecol.org/vol4/iss2/art3.
Ryan, K. C. 2002. Dynamic interactions between forest structure and fire behaviour in boreal ecosystems. Silva Fennica 36(1):13-39.
Rykiel, E. J., Jr. 1996. Testing ecological models: the meaning of validation. Ecological modeling 90:229-244.
Seppälä, J., and T. Jouttijarvi, editors. 1997. Metsateollisuus ja ymparisto. Suomen ymparisto, Number 89. Oy Edita Ab, Helsinki, Finland.
Soares-Filho, B. S., G. C. Cerqueira, and C. L. Pennachin. 2002. DINAMICA-A stochastic cellular automata model designed to simulate the landscape dynamics in an Amazonian colonization frontier. Ecological modeling 154:217-235.
Syrjänen, K., R. Kalliola, A. Puolasmaa, and J. Mattson. 1994. Landscape structure and forest dynamics in subcontinental Russian European taiga. Annales Zoologici Fennici 31:19-34.
Tomppo, E. 1991. Satellite image-based national forest inventory of Finland. International Archives of Photogrammetry and Remote Sensing 28:419-424.
Tomppo, E., C. Goulding, and M. Katila. 1999. Adapting Finnish multi-source forest inventory techniques to the New Zealand preharvest inventory. Scandinavian Journal of Forest Research 14:182-192.
Tomppo, E., K. T. Korhonen, J. Heikkinen, and H. Yli-Kojola. 2001. Multi-source inventory of the forests of the Hebei Forestry Bureau, Heilongjiang, China. Silva Fennica 35:309-328.
Trzcinski, M. K., L. Fahrig, and G. Merriam. 1999. Independent effects of forest cover and fragmentation on the distribution of forest breeding birds. Ecological Applications 9:586-593.
Turner, M. G., R. H. Gardner, and R. V. O'Neill. 1995. Ecological dynamics at broad scales, ecosystems and landscapes. Bioscience 45(6):S29-S35.
Urban, D., and T. Kiett. 2001. Landscape connectivity: a graph-theoretic perspective. Ecology 82:1205-1218.
Uuttera, J., M. Maltamo, and K. Kuusela. 1996. Impact of forest management history on the state of forests in relation to natural forest succession; comparative study North Karelia, Finland vs. Republic of Karelia, Russian Federation. Forest Ecology and Management 83:71-85.
Van Wagner, C. E. 1978. Age-class distribution and the forest fire cycle. Canadian Journal of Forest Research 8:220-227.
Wallenius, T., T. Kuuluvainen, R. Heikkilä, and T. Lindholm. 2002. Spatial tree age structure and fire history in two old-growth forests in eastern Fennoscandia. Silva Fennica 36(1):185-199.
Wiens, J. A., N. C. Stenseth, and B. Van Horne. 1993. Ecological mechanisms and landscape ecology. Oikos 66(3):369-380.
Yaroshenko, A. Y., P. V. Potapov, and S. A. Turubanova. 2001. The last intact forest landscapes of Northern European Russia. Greenpeace Russia and Global Forest Watch, Moscow, Russia.
Address of Correspondent:
Charles Burnett
Department of Geography
University of Victoria
PO BOX 3050 STN CSC
Victoria, B.C., V8W 3P5, Canada
Phone: +1-250-412-3059
Fax: +1-250-386-9984
cburnett@uvic.ca
![]()