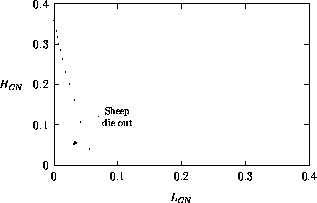
FIGURE 25:
Two-parameter continuation of the limit point in Figure 24.
(To determine the behavior corresponding to a particular region in this
two-parameter diagram, choose values for  and
and  in this
region and then use XPPAUT to integrate the system numerically.)


 and
and  in this
region and then use XPPAUT to integrate the system numerically.)
